Q2 2026
Quarterly Market Report
Bitcoin Market
|
Mining Insights

Contents
01
Abstract
Market & Investors
Bitcoin's second quarter of 2026 turned a brief spring rally into a sustained decline, closing near a new local low as the institutional demand that carried the prior cycle stepped back. Sentiment indicators softened across long and short term cohorts and valuations compressed toward the market's aggregate cost basis, yet the quarter's most telling signal came from the holders who kept buying while nearly everyone else sold.


Mining Sector
For miners, the quarter was a test of endurance. Falling prices and thinning hashprice pushed profitability to the edge for all but the lowest cost operators, and a sharp June difficulty adjustment revealed just how much capacity was operating on borrowed time. How the industry responded, by holding its coins and leaning further into AI infrastructure, said as much about its direction as the numbers themselves.
02
BTC News

Bitcoin (BTC) ETFs Face Record $4 Billion in June Outflows, Worst Since Launch
United States listed spot Bitcoin exchange traded funds were on track for their worst month of withdrawals since launching in January 2024, with investors pulling more than $4.1 billion from the 13 funds over the course of June, according to data compiled by Bloomberg. BlackRock's IBIT, the largest fund in the category, accounted for roughly $3 billion of those outflows. The report framed the withdrawals as part of a broader retreat by Bitcoin's largest institutional sources of demand, coinciding with renewed questions over the financing approach behind the market's largest corporate holder.

Michael Saylor's Strategy Sold 32 Bitcoin for $2.5 Million to Fund Dividend Payments
Strategy, the publicly traded company led by Michael Saylor, sold 32 Bitcoin for approximately $2.5 million between May 26 and May 31, according to a regulatory filing. The sale, executed at an average price of approximately $77,135 per coin, marked the company's first net Bitcoin sale in roughly four years and was used to fund dividend payments on its STRC perpetual preferred stock. The disposal represented a negligible fraction of Strategy's holdings, which stood at 843,706 Bitcoin at an average acquisition price of approximately $75,699. Saylor had signaled the move in advance on the company's first quarter earnings call, and following the filing the company's shares declined approximately 6%.

Mt. Gox Moves 10,422 Bitcoin Worth $739 Million to a New Wallet as Deadline Nears
The Mt. Gox estate moved 10,422 Bitcoin worth approximately $739 million to a new wallet, its largest transfer in months, as the exchange's long running creditor repayment process approached its deadline. The majority of the coins were sent to a previously unseen address, while a smaller portion moved to a known hot wallet, and none of the Bitcoin had yet been forwarded to a custody provider or exchange. The estate still holds roughly 34,504 Bitcoin valued at approximately $2.43 billion for distribution to about 19,500 creditors. Repayments began in mid 2024, and the final deadline was extended to October 31, 2026 by a Tokyo court in October 2025.
News Commentary
The second quarter's news flow centered on the withdrawal of the institutional demand that had underpinned Bitcoin through 2025. The record ETF outflows and Strategy's first Bitcoin sale in four years arrived as the market slid toward a new local low near $58,500, and together they signaled that two of the largest structural buyers of the prior cycle were, at least temporarily, stepping back. Strategy's disposal was economically immaterial, amounting to a rounding error against its holdings, yet its symbolism carried weight in a quarter defined by fragile sentiment. The Mt. Gox transfer added a familiar overhang, though its context has shifted: with the repayment deadline now set for October 2026 and distributions already years underway, the decade long saga appears to be approaching its conclusion rather than opening a new chapter of uncertainty. Taken together, these developments describe a market absorbing the retreat of its marginal buyers while the last large legacy supply event moves closer to resolution.
03
Long-Term Sentiment
Entity-Adjusted NUPL

The Entity-Adjusted Net Unrealized Profit/Loss (NUPL) metric visualizes the average sentiment of Bitcoin investors by measuring the size of unrealized profit relative to the market cap. When NUPL is high, most investors are sitting on unrealized profits, suggesting optimism or even euphoria. When it turns negative, it reflects widespread unrealized losses, typically marking periods of capitulation. The color bands help highlight investor psychology over time.
Entity Adjusted NUPL opened the quarter at approximately 0.22 and drifted lower to approximately 0.12 by the end of June, after briefly reaching approximately 0.36 during the April strength. The reading remained within the Hope/Fear band throughout the period and closed near the lower edge of that zone, indicating that while the aggregate investor base still held unrealized profits, the cushion had thinned considerably as prices fell. The metric never crossed into negative territory, which suggests the market avoided outright capitulation at the network level. Even so, the steady compression over the quarter reflects a sentiment backdrop that grew progressively more defensive as the drawdown extended into the second half of the period.
BTC: Realized Profit/Loss Ratio

The Realized Profit/Loss (PnL) Ratio in logarithmic scale measures the aggregate USD value of profits versus losses realized by investors over time. When this ratio is above 1, the market is realizing more profits than losses, which is indicative of a confident or bullish environment. Conversely, a ratio below 1 indicates more coins are being sold at a loss, often aligned with bearish sentiment or capitulation. This version of the metric applies a 30-day moving average to smooth out short-term volatility and better identify market phases.
Early in the quarter the Realized Profit/Loss Ratio held near 1, reflecting a market realizing gains and losses in rough balance, before deteriorating sharply as the selloff accelerated. By late June the smoothed reading had fallen well below 1 into decisively loss dominant territory, closing near 0.08. The deepest red readings coincided with the June liquidation events, when a meaningful share of coins moving on chain changed hands below their cost basis. The trajectory points to a quarter that began with tentative equilibrium and ended in broad based loss realization, a pattern consistent with the forced selling that characterized the final weeks of the period.
BTC: Long-Term Holder Net Position Change

The Long-Term Holder (LTH) Net Position Change metric measures the 30-day net change in Bitcoin supply held by wallets that have held their coins for at least 155 days. When values are positive (green), it signals that LTHs are accumulating Bitcoin. Negative values (red) indicate that LTHs are distributing, often taking profits. Because LTHs are often viewed as strategic investors, their behavior is considered a strong indicator of broader market cycle phases.
Long term holders accumulated throughout the second quarter, a notable divergence from the distribution posture seen in the prior period. The 30 day net position change remained positive across the entire quarter, opening near 120,000 BTC of net accumulation and easing to approximately 58,000 BTC by the end of June without ever turning negative. This persistence indicates that the cohort widely regarded as the market's strategic base continued to add supply into price weakness rather than sell into it. The behavior stands in clear contrast to the deteriorating short term sentiment metrics and suggests that experienced holders treated the drawdown as an accumulation opportunity rather than a reason to reduce exposure.
BTC: Long-Term Holder Net Position Change
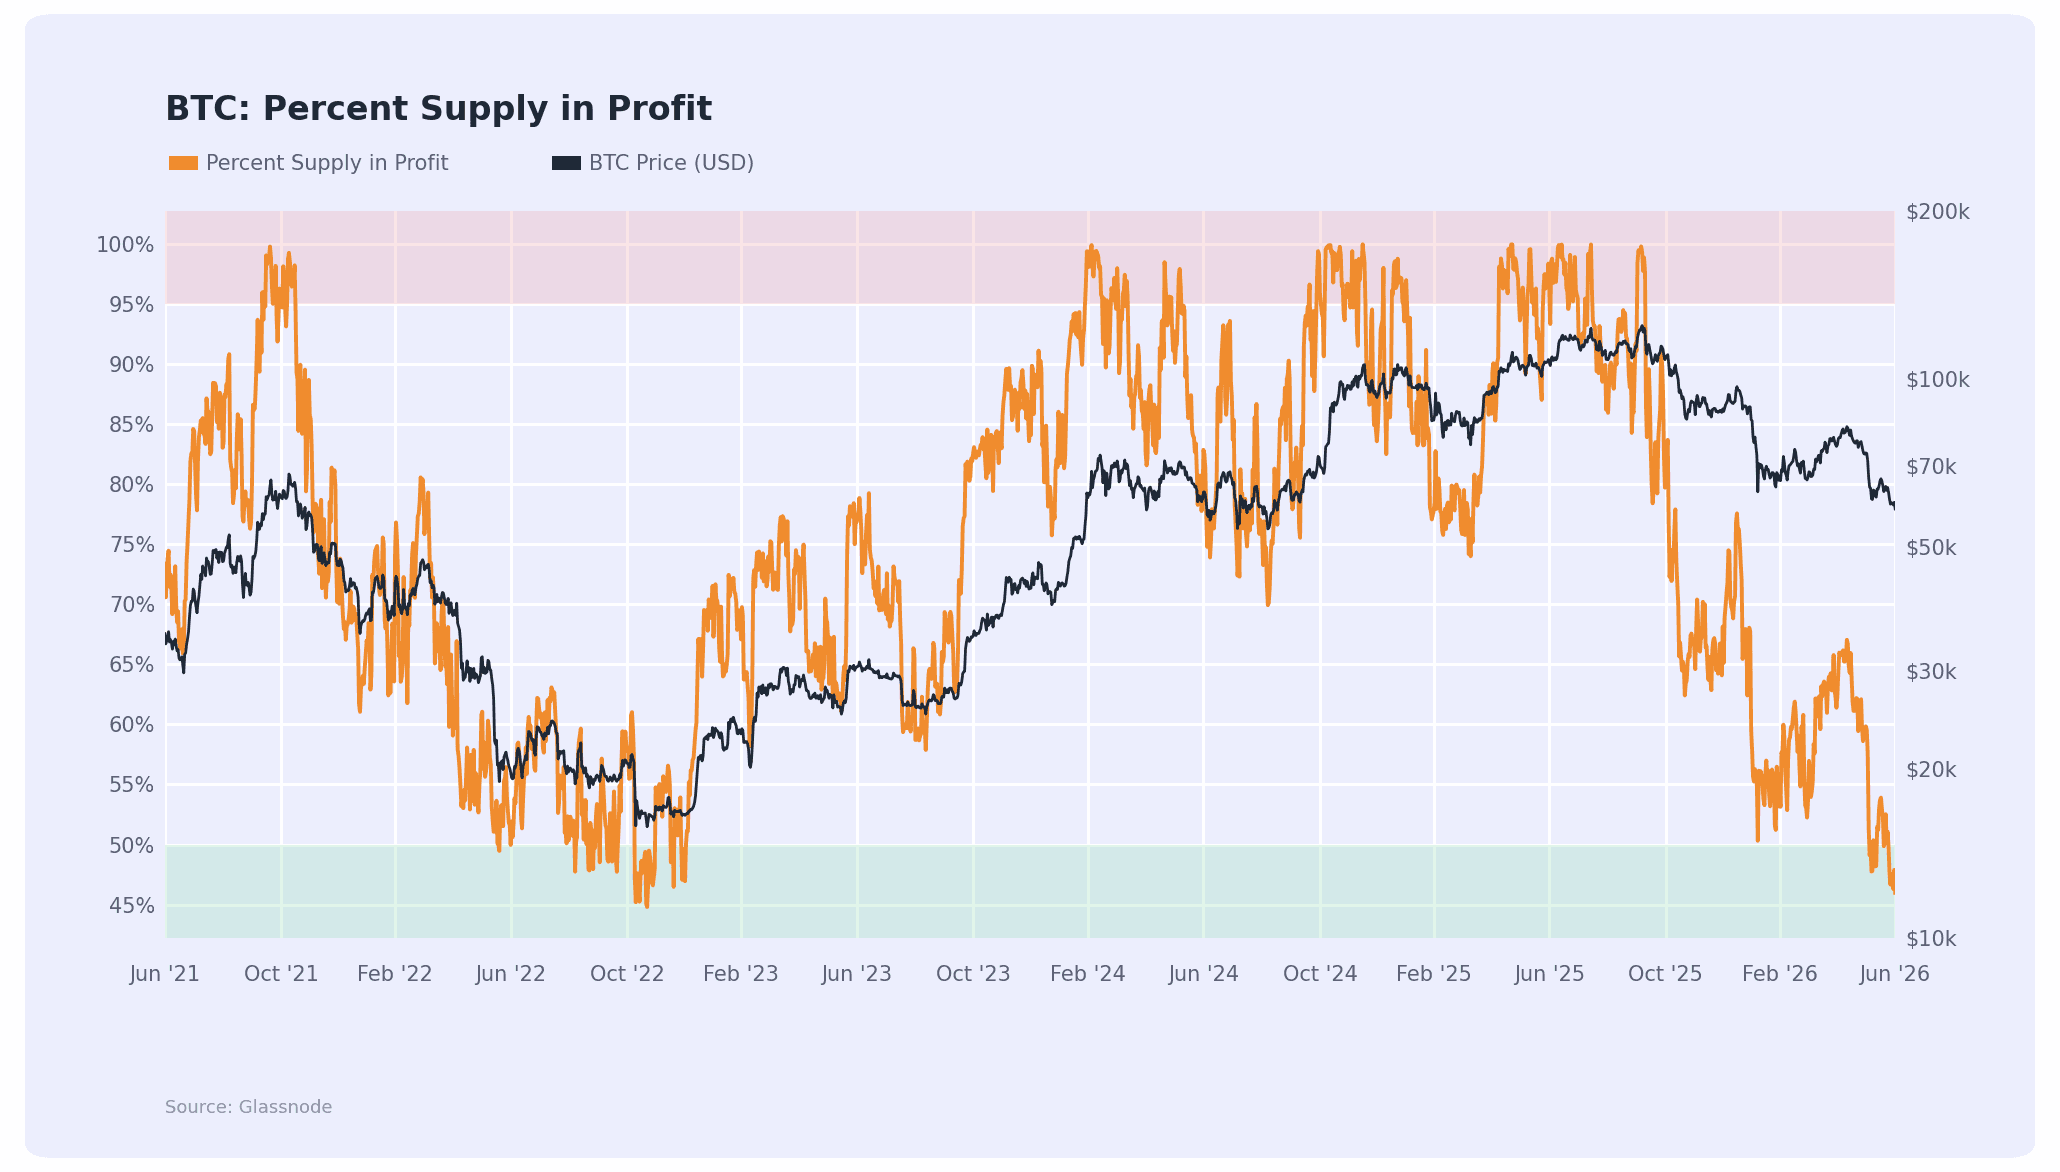
The Percent Supply in Profit chart shows the proportion of Bitcoin's circulating supply that is currently held at a profit. This means the current market price is higher than the price at which each coin last moved. This percentage acts as a broad indicator of market sentiment. High values usually reflect optimism or euphoria, while low values suggest capitulation or bearish conditions.
The share of supply held in profit fell from approximately 56% at the start of the quarter to approximately 46% by the end of June, dipping below the symbolic 50% threshold and into the zone historically associated with value territory. At the April high the reading had reached approximately 67%, so the decline over the following months moved roughly one in ten additional coins into an unrealized loss. A reading below 50% means the majority of circulating supply now sits underwater, a condition not seen since the depths of the previous bear phase. While such levels have historically preceded periods of accumulation, the speed of the move reflects how much of the supply was acquired at the elevated prices of the prior year.
Long Term Sentiment Commentary
Taken together, the long term sentiment indicators describe a quarter of genuine stress that nonetheless stopped short of structural capitulation. NUPL compressed but stayed positive, the Realized Profit/Loss Ratio fell decisively below neutral, and supply in profit slipped beneath 50%, all consistent with a market repricing lower and absorbing losses. Yet the most strategically significant signal ran counter to that deterioration: long term holders accumulated steadily throughout the period rather than distributing. This divergence between weakening valuation metrics and strengthening long term holder conviction suggests a market in transition, where price discovery to the downside coincided with quiet positioning by the cohort least sensitive to short term volatility. The configuration points less to a breakdown than to a redistribution of supply from weaker to stronger hands at progressively lower prices.
04
Short-Term Sentiment
BTC: Entity-Adjusted STH-NUPL

This metric captures the net unrealized profit or loss of Bitcoin held by short-term holders, defined as entities that acquired their coins within the last 155 days. It is calculated by comparing the current market value of short-term holder coins to their cost basis. Positive values indicate that these holders are sitting on unrealized profits, while negative values suggest they are underwater. Because short-term holders are more likely to react emotionally to price swings, this metric provides insight into speculative sentiment and can help identify local tops and bottoms in the market.
Short term holders spent the entire quarter underwater. Entity Adjusted STH-NUPL opened at approximately negative 0.22, briefly surfaced near zero during the April rebound, and closed at approximately negative 0.26, remaining in the capitulation band for the vast majority of the period. The persistently negative reading indicates that entities who acquired Bitcoin within the prior 155 days were, on aggregate, holding coins below their cost basis for almost the entire quarter. Because this cohort tends to respond emotionally to price movement, sustained readings of this depth typically coincide with elevated sell pressure and heightened vulnerability to further downside, a dynamic that played out through the June liquidations.
BTC: Realized Profit/Loss Ratio

This metric measures the ratio between realized profits and realized losses for short-term holders (STHs), defined as addresses holding BTC for less than 155 days. A ratio above 1 means STHs are realizing more profit than loss, indicating a risk-on or bullish sentiment. A ratio below 1 signals more losses than profits, typically reflecting capitulation or a loss of confidence. Because short-term holders are more sensitive to price movements, this metric offers a real-time view of how speculative participants are behaving and how they are responding to prevailing market conditions.
Reinforcing that picture, the short term holder Realized Profit/Loss Ratio remained below 1 for 71 of the quarter's 91 days, closing near 0.02 on a smoothed basis. The ratio spent the period overwhelmingly in loss dominant territory, with only a brief window of profit realization during the April strength before collapsing through May and June. Readings at these levels imply that short term holders were realizing losses at a rate far exceeding gains, a hallmark of capitulation among recent buyers. The severity and duration of the sub 1 readings suggest that the speculative cohort bore the brunt of the quarter's repricing, capitulating into the weakness rather than defending their positions.
Short-Term Sentiment Commentary
The short term sentiment indicators point to a cohort under sustained pressure throughout the quarter. Both Entity Adjusted STH-NUPL and the short term holder Realized Profit/Loss Ratio spent almost the entire period in loss territory, confirming that recent buyers were underwater and realizing losses at an elevated pace. This is the group most prone to capitulation, and the depth of the readings suggests that much of the quarter's selling originated here rather than from longer tenured holders. While such conditions create real downside pressure in the near term, they also tend to accompany the later stages of a shakeout, when weaker hands exit and supply concentrates among holders with higher conviction. The contrast with the accumulating long term cohort reinforces the impression of a market clearing out speculative excess rather than entering a deeper structural decline.
05
Pricing Models
Bitcoin: Realized Price and MVRV

The Realized Price represents the average cost basis of the Bitcoin market and often acts as a foundation during periods of correction, while the Market Value to Realized Value (MVRV) ratio compares market value to that cost basis to gauge overall valuation extremes. MVRV values above 1 indicate that the market is, on average, in profit, while readings above 2.5 have historically coincided with overheated conditions and cycle tops. Together, these metrics illustrate how far market pricing has moved from its aggregate cost structure and help identify periods of either undervaluation or excess.
Market price held above its aggregate cost basis for the full quarter, but the premium narrowed sharply. Realized Price was roughly flat near $53,000 to $54,000, while spot fell from approximately $68,100 to approximately $58,500, compressing MVRV from approximately 1.26 to approximately 1.10 after briefly reaching approximately 1.52 during the April high. An MVRV near 1.10 indicates that the market was, on average, only marginally in profit by quarter end, with spot price sitting just above the level at which the entire network would be at breakeven. The steady compression toward 1 reflects a valuation resetting toward its cost structure, a condition that has historically marked zones of undervaluation rather than excess, though it also leaves limited buffer before the aggregate market would move into an unrealized loss.
Bitcoin: Long/Short-Term On-chain Cost Basis

The Long/Short-Term Holder Cost Basis model compares the average purchase price of two distinct investor groups. Long-term holders (LTHs), who have held their Bitcoin for more than 155 days, typically represent market conviction and macro support levels, while short-term holders (STHs), who acquired coins within the past 155 days, reflect more reactive and speculative sentiment. When the current price trades above the STH cost basis, it signals that recent investors are in profit, which often correlates with bullish momentum. Conversely, when the price falls below the STH cost basis, it indicates newer buyers are underwater and may panic sell. Meanwhile, the LTH cost basis tends to act as a strong floor in bear markets, rarely breached unless under extreme stress.
The spread between the two holder cohorts told the clearest story of the quarter. Short term holder cost basis fell from approximately $82,500 to approximately $70,300 as higher priced coins repriced, yet it remained well above spot for the entire period, confirming that recent buyers stayed underwater. Long term holder cost basis, by contrast, rose from approximately $44,300 to approximately $49,400 and held below market price throughout, meaning the strategic base retained a comfortable profit margin even at the quarter's lows. Spot price spent the quarter between these two levels, above the long term cost basis but beneath the short term one, and never fell below all of the on chain cost models simultaneously. This configuration points to a market under pressure at the margin while its structural support near the long term cost basis remained intact.
Pricing Model Commentary
The valuation models converge on a consistent reading: the market repriced meaningfully lower without breaching its structural floor. MVRV compressed toward 1 as spot approached its aggregate cost basis, while the cost basis model showed price falling below the short term holder level but holding above the long term one. Together these signals describe a market that gave back the speculative premium of the prior year yet retained the support provided by its most committed holders. The proximity of spot to Realized Price and to the long term cost basis suggests the quarter ended near a zone that has historically offered value, provided broader conditions stabilize. The absence of any breach below the full set of cost models is notable, indicating that even at its weakest the market did not enter the deep undervaluation associated with prior cycle bottoms.
06
News
Bitcoin Mining

Bitcoin Mining Network Becoming More Sensitive to Price Swings, JPMorgan Says
JPMorgan reported that the Bitcoin mining network has grown more sensitive to price swings, with the sensitivity of mining difficulty to Bitcoin's price rising to a beta of 0.62 over the prior six months. According to the bank's analysis led by Nikolaos Panigirtzoglou, roughly 20% of miners were operating unprofitably, and Bitcoin had traded below the estimated production cost of approximately $78,000 for five consecutive months, with the price near $64,700 at the time of publication. The report noted that higher cost operators had been shutting down equipment as prices fell below their breakeven levels, causing hashrate to decline and difficulty to adjust lower, including the 10% reduction recorded in the second week of June. It also observed that publicly traded miners had liquidated more than 32,000 Bitcoin during the first quarter, exceeding their combined sales for all of 2025.
Bitcoin Mining Difficulty Drops 10% in 11th Largest Downward Adjustment
Bitcoin's mining difficulty fell 10.09%, dropping from 138.96T to 124.93T at block 953,568, in what ranked as the eleventh largest downward adjustment in the network's history and the second largest of 2026. The reduction followed an estimated 12% decline in hashrate over the month, with the mining epoch stretching to 15.6 days against the typical 14 as computing power came offline. The report attributed the pullback to Bitcoin's roughly 15% decline through June, which squeezed miner margins and pushed higher cost operators to power down. As a result of the adjustment, hashprice rose approximately 13% to approximately $0.033/TH per day, leaving the remaining miners earning roughly 9% more per machine.


CleanSpark Posts $378M Fiscal Q2 Loss as Bitcoin Price Drop Bites
CleanSpark reported a net loss of $378.3 million for its fiscal second quarter ended March 31, 2026, widening from a $138.8 million loss in the same period a year earlier. Revenue fell to $136.4 million from $181.7 million, while a $224.1 million loss tied to the declining fair value of the company's Bitcoin holdings accounted for nearly 60% of the total quarterly loss. Despite the reported loss, the company grew its Bitcoin holdings by 14% year over year to $925.2 million and increased its average monthly hashrate by 18%, while its contracted power capacity doubled. Chief Executive Matt Schultz framed the quarter around commercializing the company's AI and high performance computing assets alongside continued mining, describing the effort as central to CleanSpark's transformation.
News Commentary
The mining stories of the quarter describe an industry operating at the edge of profitability. JPMorgan's finding that a fifth of miners were unprofitable and that Bitcoin had traded below production cost for five straight months was borne out by the network's response, as the 10% difficulty reduction in June confirmed that higher cost operators were powering down in real time. CleanSpark's $378 million loss, driven overwhelmingly by the markdown of its Bitcoin treasury, illustrated how directly the price decline flowed through to miner balance sheets, even for operators expanding hashrate and capacity. Yet the same reports pointed to adaptation as much as distress: the difficulty adjustment lifted hashprice and improved per machine economics for surviving miners, while CleanSpark and its peers continued to build toward AI and high performance computing revenue as a hedge against Bitcoin's volatility. The through line is an industry consolidating around efficient, well capitalized operators while the marginal capacity that defined the previous expansion is steadily pruned.
Mining Introduction
Bitcoin opened the second quarter at approximately $68,100 and closed at approximately $58,500, a decline of approximately 14%, though the path was uneven: price rallied toward $82,000 in April before giving way to a sustained decline through May and June that ended at the quarter's low. Network difficulty was largely unchanged over the period on a standard basis, holding near 134T at both the start and the end of the quarter, but that stability concealed a sharp mid June adjustment that saw difficulty fall approximately 10% to 124.93T as hashrate came offline, before recovering into quarter end. Hashprice, which measures the expected daily revenue per unit of hashrate, hovered near $0.030/TH per day for much of the quarter, briefly rising above $0.033/TH per day following the June difficulty reduction before easing to approximately $0.0295/TH per day by the end of June. The combination of lower prices and compressed revenue kept miner margins under pressure throughout the period.
The ASIC hardware market continued to reprice lower across every efficiency tier. High efficiency machines rated under 19 J/TH fell from approximately $4.50/TH to approximately $2.30/TH, a decline of roughly 49%. Mid tier units in the 19 to 25 J/TH range eased from approximately $2.00/TH to approximately $1.40/TH, while older generation hardware rated 25 to 38 J/TH slipped from approximately $1.00/TH to approximately $0.70/TH. The continued erosion in secondary market hardware values reflects the same margin pressure visible in hashprice and profitability, as operators weighed the cost of running older equipment against thinning returns. At prevailing hashprice levels, only the most efficient rigs paired with low cost power retained a durable economic advantage, reinforcing the ongoing shift of capital toward newer machines and alternative compute workloads.
07
Mining Dashboard
Bitcoin: Difficulty per Issuance Pricing Model

The Difficulty per Issuance Pricing Model is a miner-centric valuation tool that establishes a lower bound estimate for Bitcoin's fair value by combining two key variables: network difficulty and issuance rate. Difficulty reflects the computational effort required to mine blocks, serving as a proxy for capital investment and network security. Issuance refers to the number of new BTC created through mining, which diminishes over time as halvings occur. This model uses a smoothed average of difficulty and adjusts for reduced issuance, yielding a dynamic cost-floor estimate that reflects the production pressures on miners. As difficulty rises and issuance drops, the modeled price increases, anchoring the long-term market structure to miner behavior and economic feasibility.
Spot price spent the quarter compressed against the model's lower bands, underscoring the pressure on miner economics. By the end of June, Bitcoin's price of approximately $58,500 sat between the base PoW Pricing Model near $46,400 and the Model x1.41 band near $65,400, having fallen from a position closer to the upper bands earlier in the period. The narrowing gap between spot and the production floor indicates that market price moved toward the modeled cost of production, the zone where miner profitability comes under the greatest strain. While price remained above the base model throughout, leaving a modest buffer above the theoretical floor, the proximity of spot to the x1.41 band by quarter end reflects an environment in which the market was pricing Bitcoin close to the economic reality faced by producers.
BTC: Miner Net Position Change

The Miner Net Position Change metric captures the 30-day rolling change in the Bitcoin balances of miner wallets. A positive value suggests miners are accumulating BTC, either by holding newly mined coins or withdrawing fewer from treasury. A negative value reflects distribution, typically selling to meet operational costs or capitalize on favorable prices. As miners are a consistent source of natural sell pressure, their behavior offers critical insight into macro supply dynamics. Accumulation implies long-term confidence and reduced immediate sell pressure, while distribution can create headwinds during uptrends or signal underlying stress during drawdowns.
Miners were modest net accumulators over the quarter despite the challenging revenue backdrop. The 30 day net position change opened at approximately positive 4,800 BTC and remained positive for most of the period, easing to approximately positive 1,200 BTC by the end of June after a brief dip into distribution mid quarter. The persistence of accumulation is notable given the margin pressure documented elsewhere, and it suggests that miners as a group chose to retain newly produced coins rather than sell aggressively into weakness. This behavior implies a degree of confidence, or at least an unwillingness to realize losses at depressed prices, and it withheld a source of sell pressure that has weighed on the market during prior downturns.
Bitcoin: ASIC Rig Profitability (Antminer S21 Pro)

The ASIC Rig Profitability metric for the Bitmain Antminer S21 Pro tracks estimated daily profits under various all-in energy cost assumptions, ranging from $0.025 to $0.125 per kWh. It calculates profitability by subtracting the rig's daily operating cost from its estimated block reward revenue based on a 218 TH/s hashrate and 3662W power consumption. Each band in the chart represents profitability at a different energy price point. This model is crucial for identifying breakeven thresholds and evaluating miner health under changing market conditions, especially across varying operational cost environments.
Profitability compressed to the thinnest levels of the cycle by the end of the quarter. For the Antminer S21 Pro, estimated daily profit at $0.05/kWh fell to under $2.00 per rig, while operators paying $0.075 to $0.08/kWh, the range typical of retail electricity, were pushed to breakeven or below on power costs alone. At the quarter's closing hashprice, only miners securing power near or below $0.05/kWh retained a clear operating margin, and the breakeven electricity cost, the power price at which daily revenue no longer covers the rig's consumption, fell to roughly $0.07/kWh. The collapse in profitability across all but the lowest cost tiers illustrates why higher cost capacity came offline during June, and it underscores the widening gap between industrial operators with access to cheap power and retail miners now operating at or beyond the edge of viability.
Mining Dashboard Commentary
The mining dashboard describes an industry compressed against its cost floor. Spot price fell toward the Difficulty per Issuance production model, profitability for the benchmark rig thinned to breakeven outside of the lowest cost power tiers, and the June difficulty adjustment confirmed that marginal capacity was being forced offline. Against that backdrop, the most constructive signal came from miner treasury behavior: rather than liquidating into the decline, miners remained modest net accumulators, withholding a source of supply that has amplified prior drawdowns. The combination of tightening economics and restrained selling suggests an industry absorbing genuine stress without panic, one in which weaker operators are being pruned while better capitalized producers hold their coins and increasingly diversify toward alternative compute. The quarter reinforced the divide between miners positioned to endure a low hashprice environment and those for whom current conditions are no longer sustainable.
Conclusion
The second quarter of 2026 extended the repricing that had defined the year, carrying Bitcoin from approximately $68,100 to a quarter ending low near $58,500 after a brief April rally toward $82,000. On chain sentiment weakened across the board: NUPL compressed toward the lower edge of the Hope/Fear zone, the Realized Profit/Loss Ratio fell decisively below neutral, supply in profit slipped beneath 50%, and short term holders spent almost the entire quarter underwater and realizing losses. Valuation models compressed toward the market's aggregate cost basis, with MVRV easing to approximately 1.10 and spot settling between the long term and short term holder cost bases. Yet beneath the deterioration ran a steadier current: long term holders accumulated throughout the quarter, and the market never breached the full set of on chain cost models, distinctions that separate a period of stress and repricing from a structural breakdown. The withdrawal of institutional demand through record ETF outflows and Strategy's first sale in four years defined the near term narrative, even as the long standing Mt. Gox overhang moved closer to final resolution.
The mining industry entered its most constrained margin environment of the cycle. Hashprice held near $0.030/TH per day, spot price fell toward the Difficulty per Issuance production floor, and profitability for even efficient hardware thinned to breakeven outside of the lowest cost power tiers. JPMorgan estimated that roughly one fifth of miners were unprofitable and that Bitcoin had traded below production cost for five consecutive months, a reality confirmed by June's 10% difficulty reduction as higher cost capacity powered down. CleanSpark's $378 million quarterly loss illustrated how directly the price decline flowed through to miner balance sheets. Still, the quarter carried signs of resilience rather than capitulation: miners remained net accumulators of Bitcoin, surviving operators saw per machine economics improve after the difficulty adjustment, and the industry continued its pivot toward AI and high performance computing as a durable revenue hedge. The pattern points to an industry consolidating around efficient, well capitalized operators, with the marginal capacity of the prior expansion steadily pruned as conditions await a more supportive price environment.