Q3 2025
Quarterly Market Report
Bitcoin Market
|
Mining Insights

Contents
01
Abstract
Market & Investors
Quarter three of 2025 continued Bitcoin’s transition from speculative cycles to structural maturity. Institutional adoption, stronger regulatory foundations, and the integration of digital assets into traditional retirement and financial systems strengthened confidence across the market. While long term holders displayed measured accumulation and short term investors sustained orderly profit taking, network data pointed to a healthy equilibrium between conviction and liquidity


Mining Sector
On the mining side, rising difficulty, stable hashprice, and continued hardware efficiency gains defined an industry operating with discipline and resilience. The full report explores how these dynamics across investor behavior, pricing models, and mining economics illustrate a market evolving toward sustainable growth rather than cyclical exuberance.
02
BTC News

“Senate Passes GENIUS Stablecoin Act, Crypto's First Major Legislative Win”
The U.S. Senate passed the GENIUS Act in June 2025 with a 68-30 vote, establishing the first federal framework for dollar-pegged aand creating a regulated pathway for private companies to issue digital dollars. The legislation sets guardrails including full reserve backing, monthly audits, and anti-money laundering compliance, while granting sweeping authority to the Department of Treasury. The bill opens the door to banks, fintechs, and major retailers to issue stablecoins, with Treasury Secretary Scott Bessent projecting the U.S. stablecoin market could grow nearly eightfold to over $2 trillion in the coming years. The bill now heads to the House for reconciliation with its own version.

“Trump Executive Order Opens 401(k) Plans to Bitcoin and Alternative Assets”
President Trump signed an executive order in August 2025 directing the Department of Labor to allow 401(k) investors to access alternative assets including Bitcoin, private equity, and real estate. The order instructs federal agencies to reexamine ERISA fiduciary duties and clarify the position on alternative assets for defined-contribution retirement plans. Over 90 million Americans participate in employer-sponsored defined-contribution plans, most of whom are currently restricted from investing in alternative assets. While there is no immediate change, federal agencies will need to rewrite rules over the coming months to enable these expanded investment options.

“BlackRock's Bitcoin ETF Generates More Revenue Than Its S&P 500 Fund”
In July 2025, BlackRock's iShares Bitcoin Trust ETF (IBIT) achieved a historic milestone by generating an estimated $187.2 million in annual fees, surpassing the $187.1 million earned by its flagship iShares Core S&P 500 ETF (IVV). Despite IVV holding approximately $624 billion in assets, nearly nine times more than IBIT's $75 billion, IBIT's 0.25% expense ratio compared to IVV's 0.03% fee made it the larger revenue generator. Since launching in January 2024, IBIT has attracted $52 billion in net inflows, representing 55% of all Bitcoin ETF assets, with inflows in 17 of its first 18 months.
News Commentary
The third quarter of 2025 marked a turning point for Bitcoin and digital assets as institutional participation, legislative clarity, and retirement account integration converged to solidify crypto's place in traditional finance. BlackRock's IBIT generating more annual revenue than its flagship 25 year old S&P 500 fund demonstrates that institutions are willing to pay a premium for exposure to this emerging asset class, with $52 billion in inflows and over half of all Bitcoin ETF market share validating the demand for regulated digital asset products. The Senate's passage of the GENIUS Act addresses a fundamental challenge that has plagued the industry since its inception: establishing trust and accountability in stablecoin issuance. By mandating full reserve backing, monthly audits, and anti money laundering compliance, the legislation provides critical infrastructure for an industry heavily reliant on stablecoins for moving capital, facilitating exchange transactions, and enabling liquidity across platforms. The Trump administration's executive order opening 401(k) plans to Bitcoin creates an ideal pathway for longterm holders who view the asset as digital gold to incorporate it into their retirement strategies, while simultaneously unlocking access to the trillions of dollars held in pension funds and institutional retirement accounts. This influx of capital from traditional retirement vehicles represents more than regulatory approval, as it signals the full integration of digital assets into the fabric of the financial system and marks a definitive step toward mainstream societal adoption.
03
Long-Term Sentiment
BTC: Entity-Adjusted Net Unrealized Profit/Loss
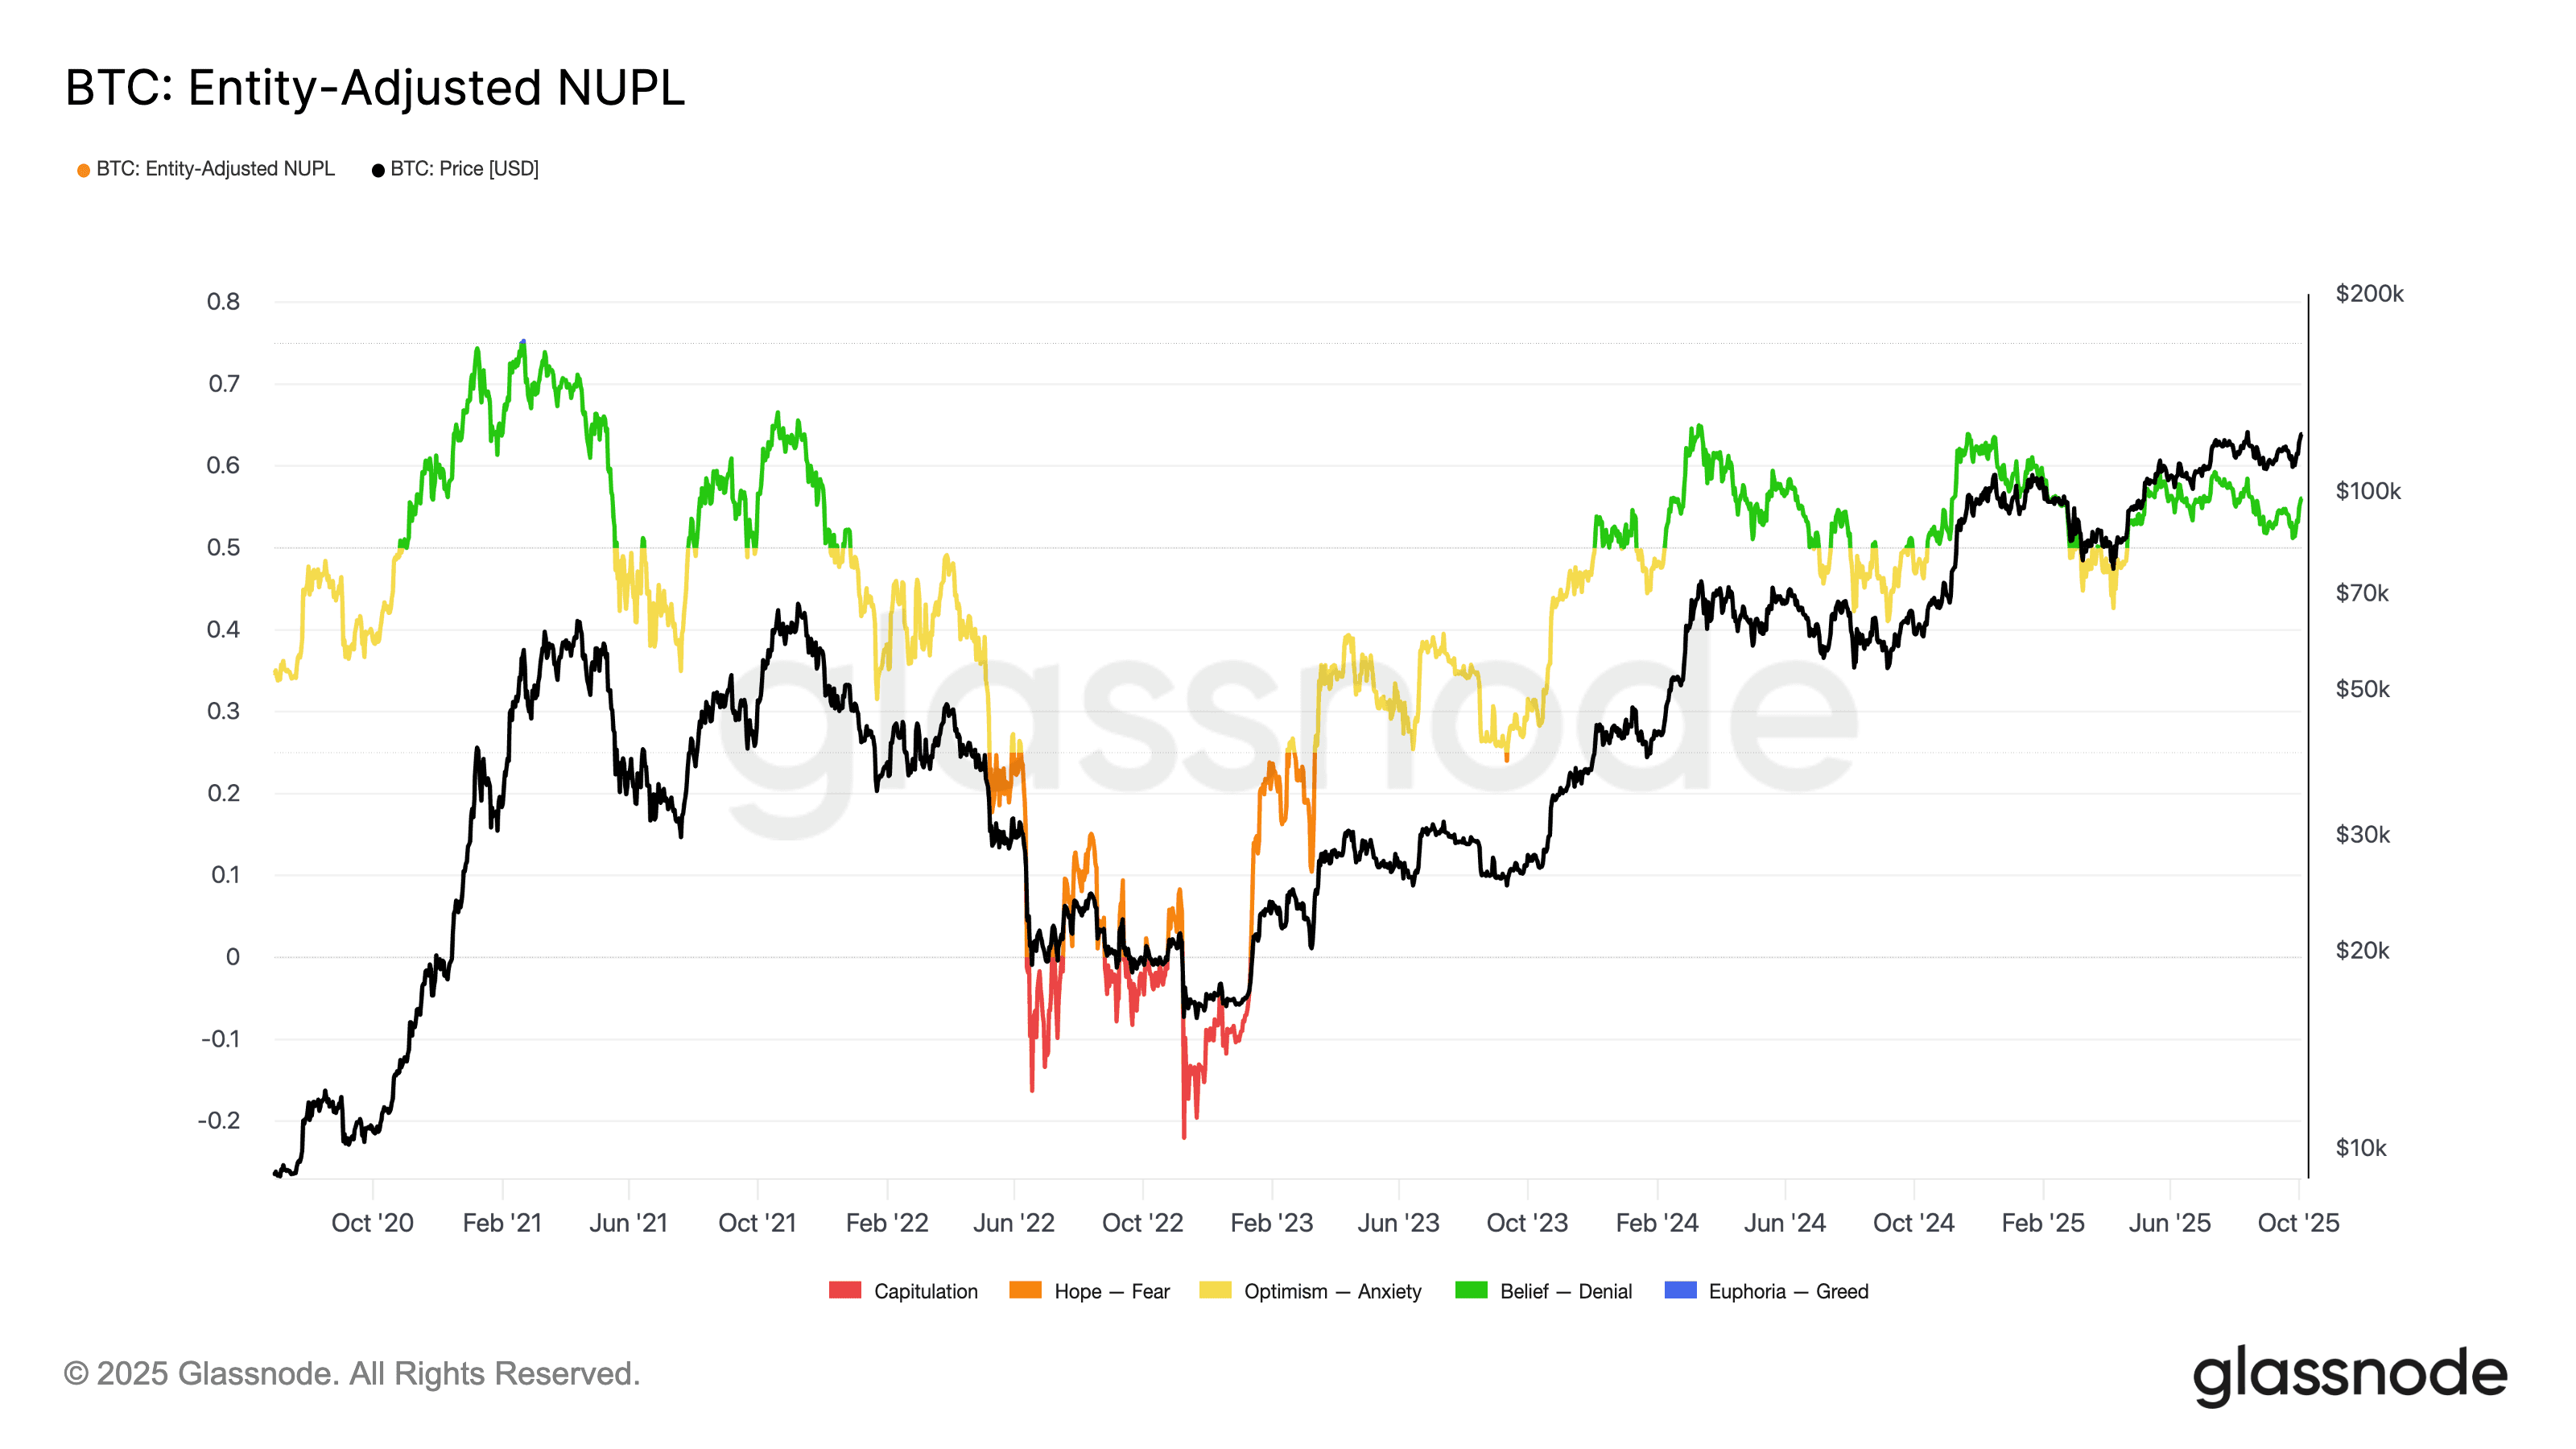
The Entity-Adjusted Net Unrealized Profit/Loss (NUPL) metric visualizes the average sentiment of Bitcoin investors by measuring the size of unrealized profit relative to the market cap. When NUPL is high, most investors are sitting on unrealized profits, suggesting optimism or even euphoria. When it turns negative, it reflects widespread unrealized losses, typically marking periods of capitulation. The color bands help highlight investor psychology over time.
During the third quarter of 2025, NUPL remained firmly within the Belief zone, oscillating between approximately 0.55 and 0.60. This positioning indicates that the majority of market participants continued to hold unrealized profits, sustaining an optimistic yet measured sentiment. The metric’s stability through the quarter shows that investors viewed market strength as durable rather than speculative, maintaining conviction despite short-term fluctuations. Historically, prolonged periods in this range have aligned with constructive phases of accumulation and measured growth, where optimism supports continued upside without signaling the excesses that precede major cycle peaks.
Realized-Profit Loss Ratio

The Realized Profit/Loss (PnL) Ratio in logarithmic scale measures the aggregate USD value of profits versus losses realized by investors over time. When this ratio is above 1, the market is realizing more profits than losses, which is indicative of a confident or bullish environment. Conversely, a ratio below 1 indicates more coins are being sold at a loss, often aligned with bearish sentiment or capitulation. This version of the metric applies a 30-day moving average to smooth out short-term volatility and better identify market phases.
The Realized Profit/Loss Ratio remained firmly above the neutral level of 1, indicating that the market continued to realize gains rather than losses throughout the period. The ratio fluctuated between roughly 1.5 and 2.2, showing that investors were locking in profits while maintaining overall confidence in Bitcoin’s strength. This balance between profit taking and stability points to an orderly and healthy market environment, one where participants are realizing returns without triggering broad corrections. Historically, such readings align with expansionary phases of the cycle, when capital continues to circulate within the network instead of exiting it, reinforcing the notion that realized activity remains a supportive force for long-term market growth.
BTC: Long-Term Holder Net Position Change
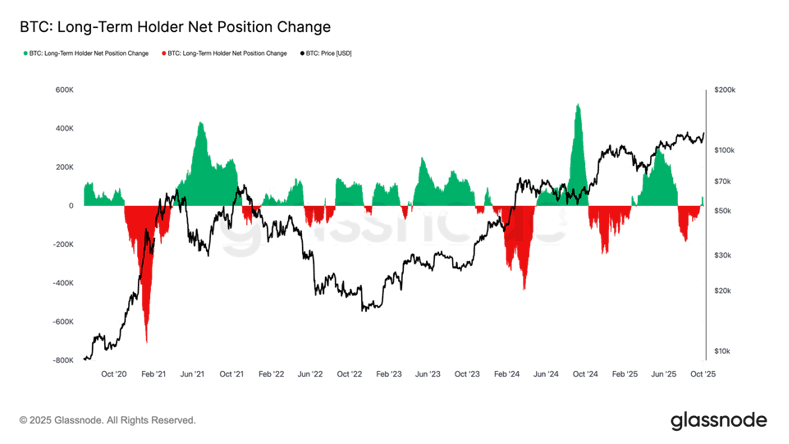
The Long-Term Holder (LTH) Net Position Change metric measures the 30-day net change in Bitcoin supply held by wallets that have held their coins for at least 155 days. When values are positive (green), it signals that LTHs are accumulating Bitcoin. Negative values (red) indicate that LTHs are distributing, often taking profits. Because LTHs are often viewed as strategic investors, their behavior is considered a strong indicator of broader market cycle phases.
Through the quarter, long term holders displayed moderate net accumulation following several months of distribution earlier in the year. The return to positive territory signals renewed confidence among mature investors, as coins continue migrating from shorter term entities into longer term storage. The scale of accumulation remains steady rather than aggressive, indicating that while conviction is firm, holders are not yet in full scale expansion mode. Historically, this type of steady inflow has marked the mid stages of a cycle advance, periods when capital rotates from active market participants back into long term storage, laying the foundation for sustainable upward momentum.
BTC: Long-Term Holder Net Position Change
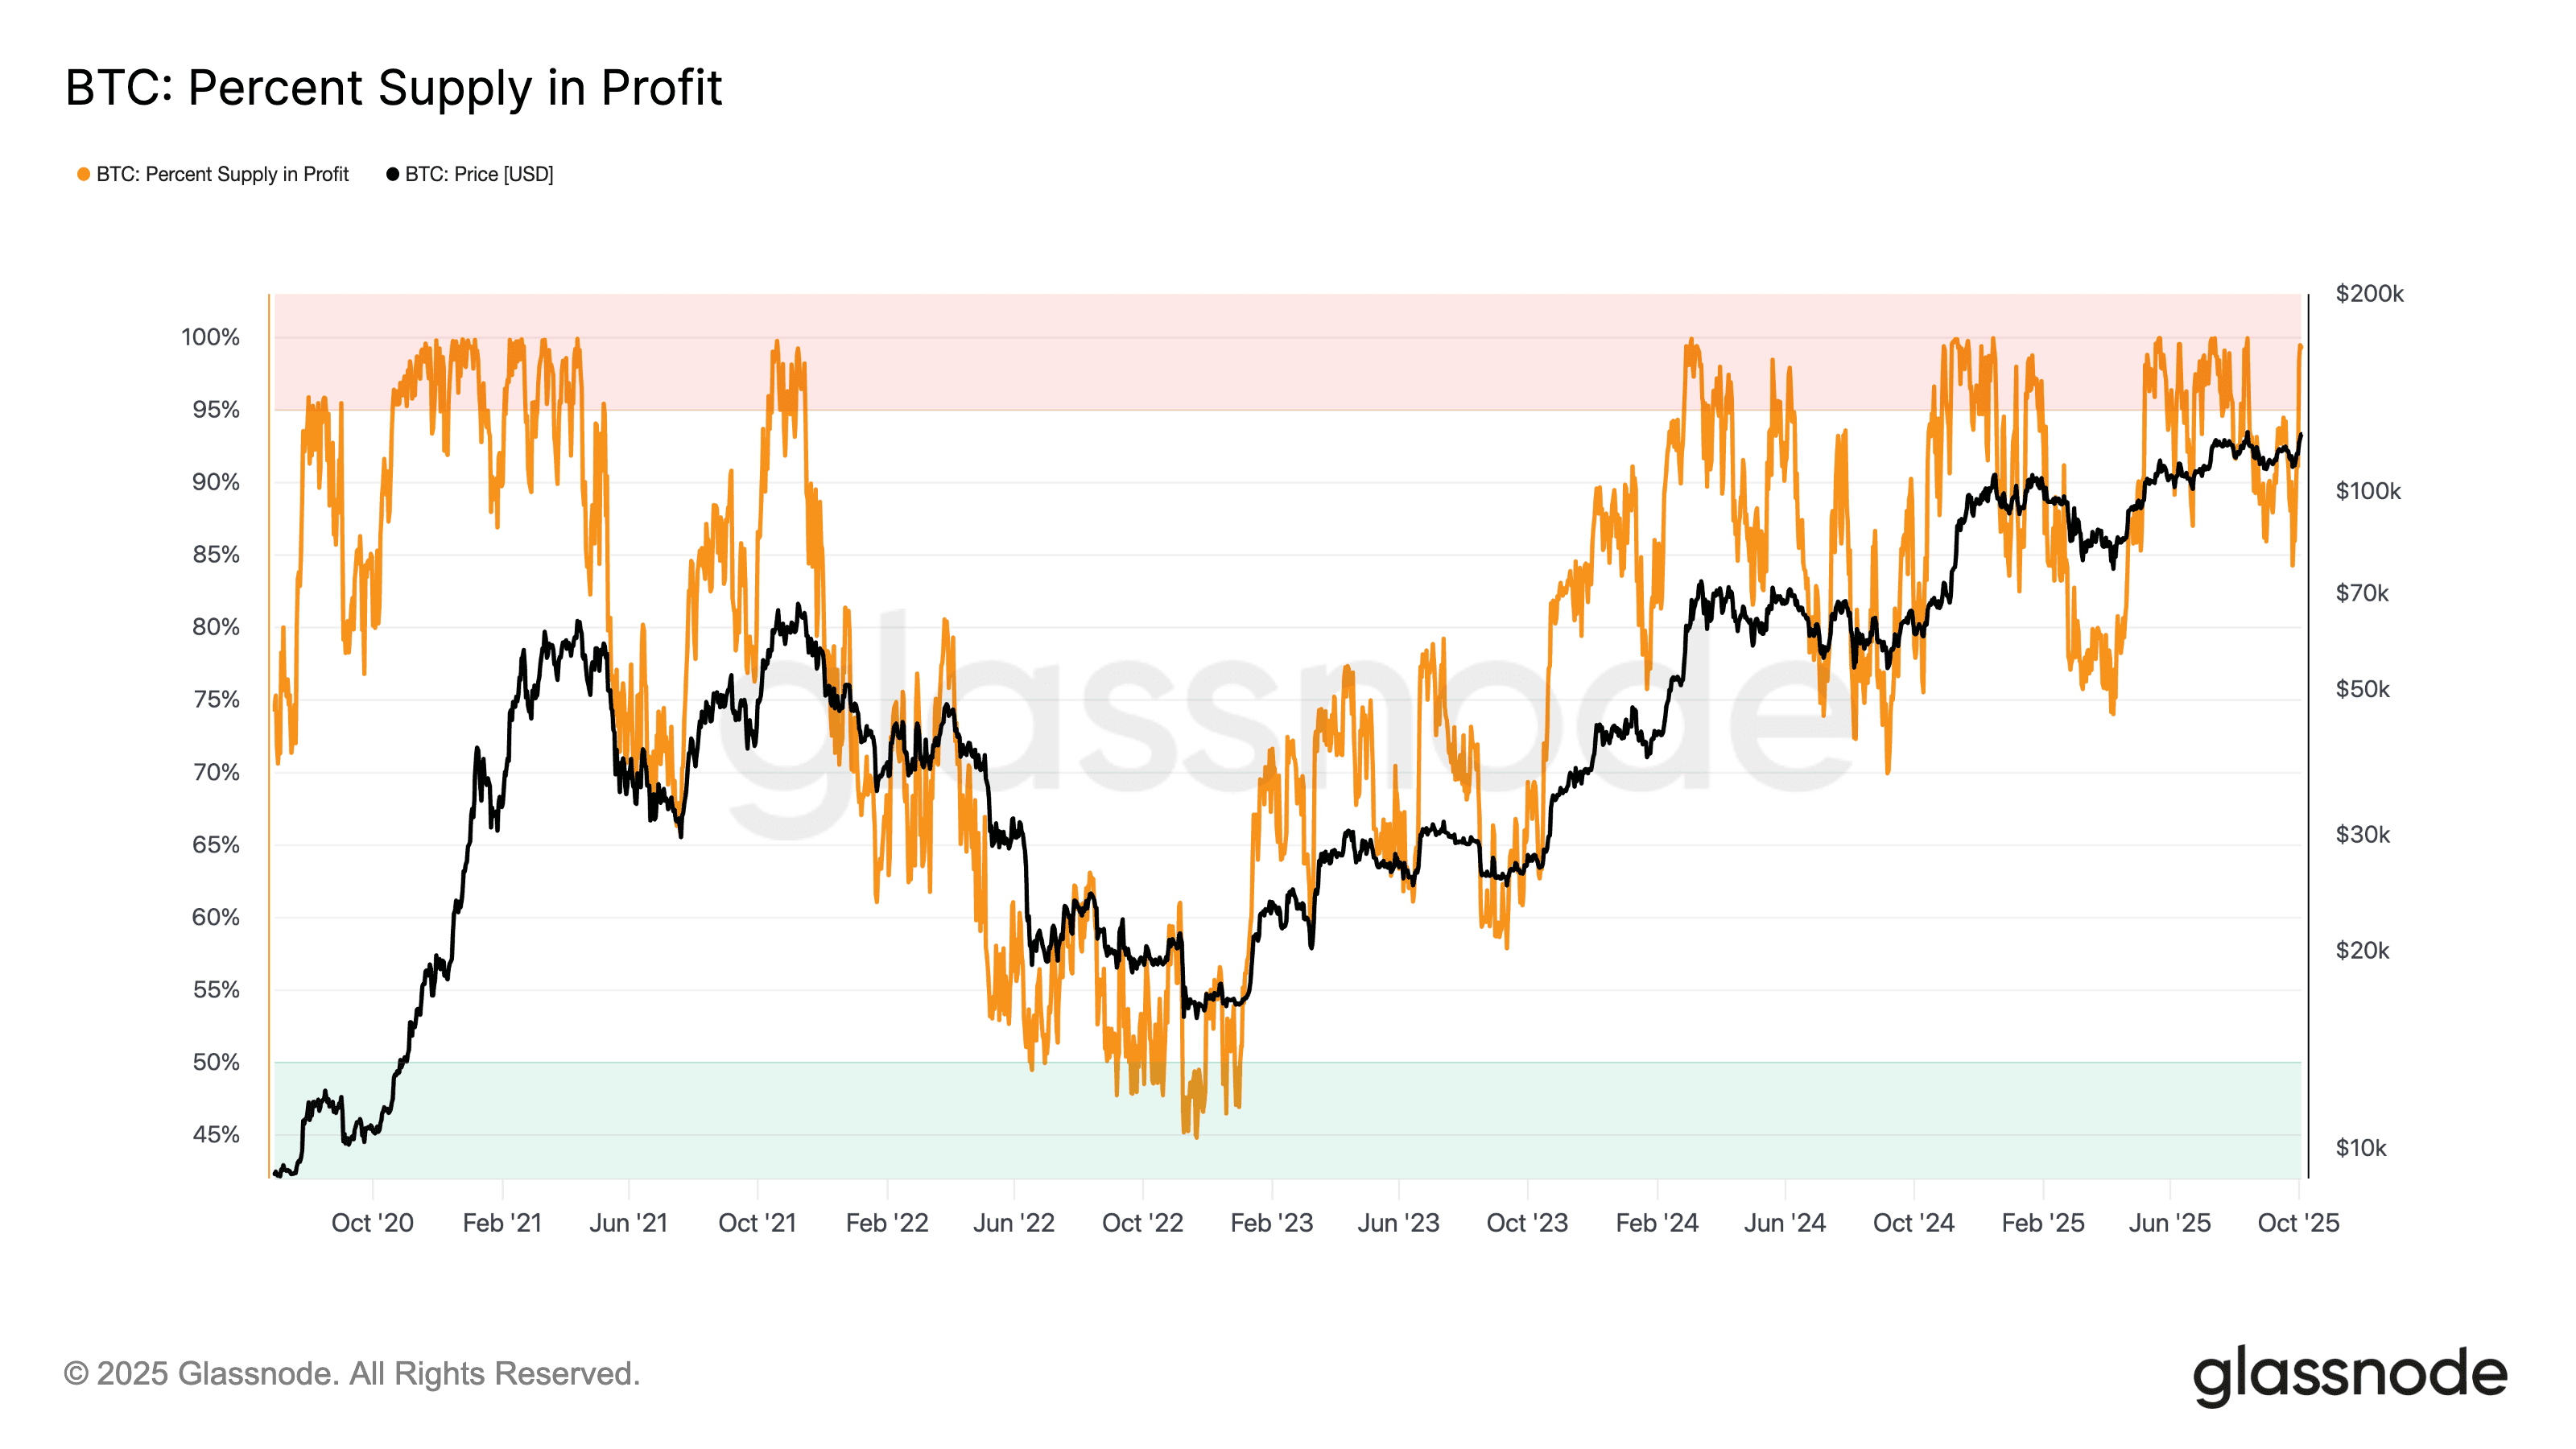
The Percent Supply in Profit chart shows the proportion of Bitcoin's circulating supply that is currently held at a profit. This means the current market price is higher than the price at which each coin last moved. This percentage acts as a broad indicator of market sentiment. High values usually reflect optimism or euphoria, while low values suggest capitulation or bearish conditions.
During the period, more than 90% of circulating supply remained in profit, maintaining one of the highest sustained levels in recent cycles. This stability highlights that most holders are sitting on gains, yet price behavior and on chain activity show limited evidence of speculative excess. The persistence of such high profitability without a corresponding surge in volatility suggests that the market is in a mature, confident phase of the cycle. Historically, prolonged stretches with this level of profitability coincide with consolidation before further expansion, implying that the market continues to display strong structural support rather than conditions associated with major distribution phases.
Long Term Sentiment Commentary
Long term sentiment through the quarter reflected a maturing phase of the cycle marked by confidence, patience, and structural strength. NUPL’s steady position in the Belief zone, combined with a Realized Profit and Loss Ratio that stayed comfortably above 1, shows a market realizing profits in an orderly way while maintaining conviction. Long term holders shifted back into net accumulation, reinforcing that supply continues to migrate toward committed investors, and the consistently high percentage of supply in profit underlines that these gains are being held rather than distributed. Together, these signals portray a market driven by measured optimism, where participants appear content to accumulate and hold through consolidation, suggesting a stable foundation for continued expansion without the speculative fervor that often precedes corrections.
04
Short-Term Sentiment
BTC: Entity-Adjusted STH-NUPL
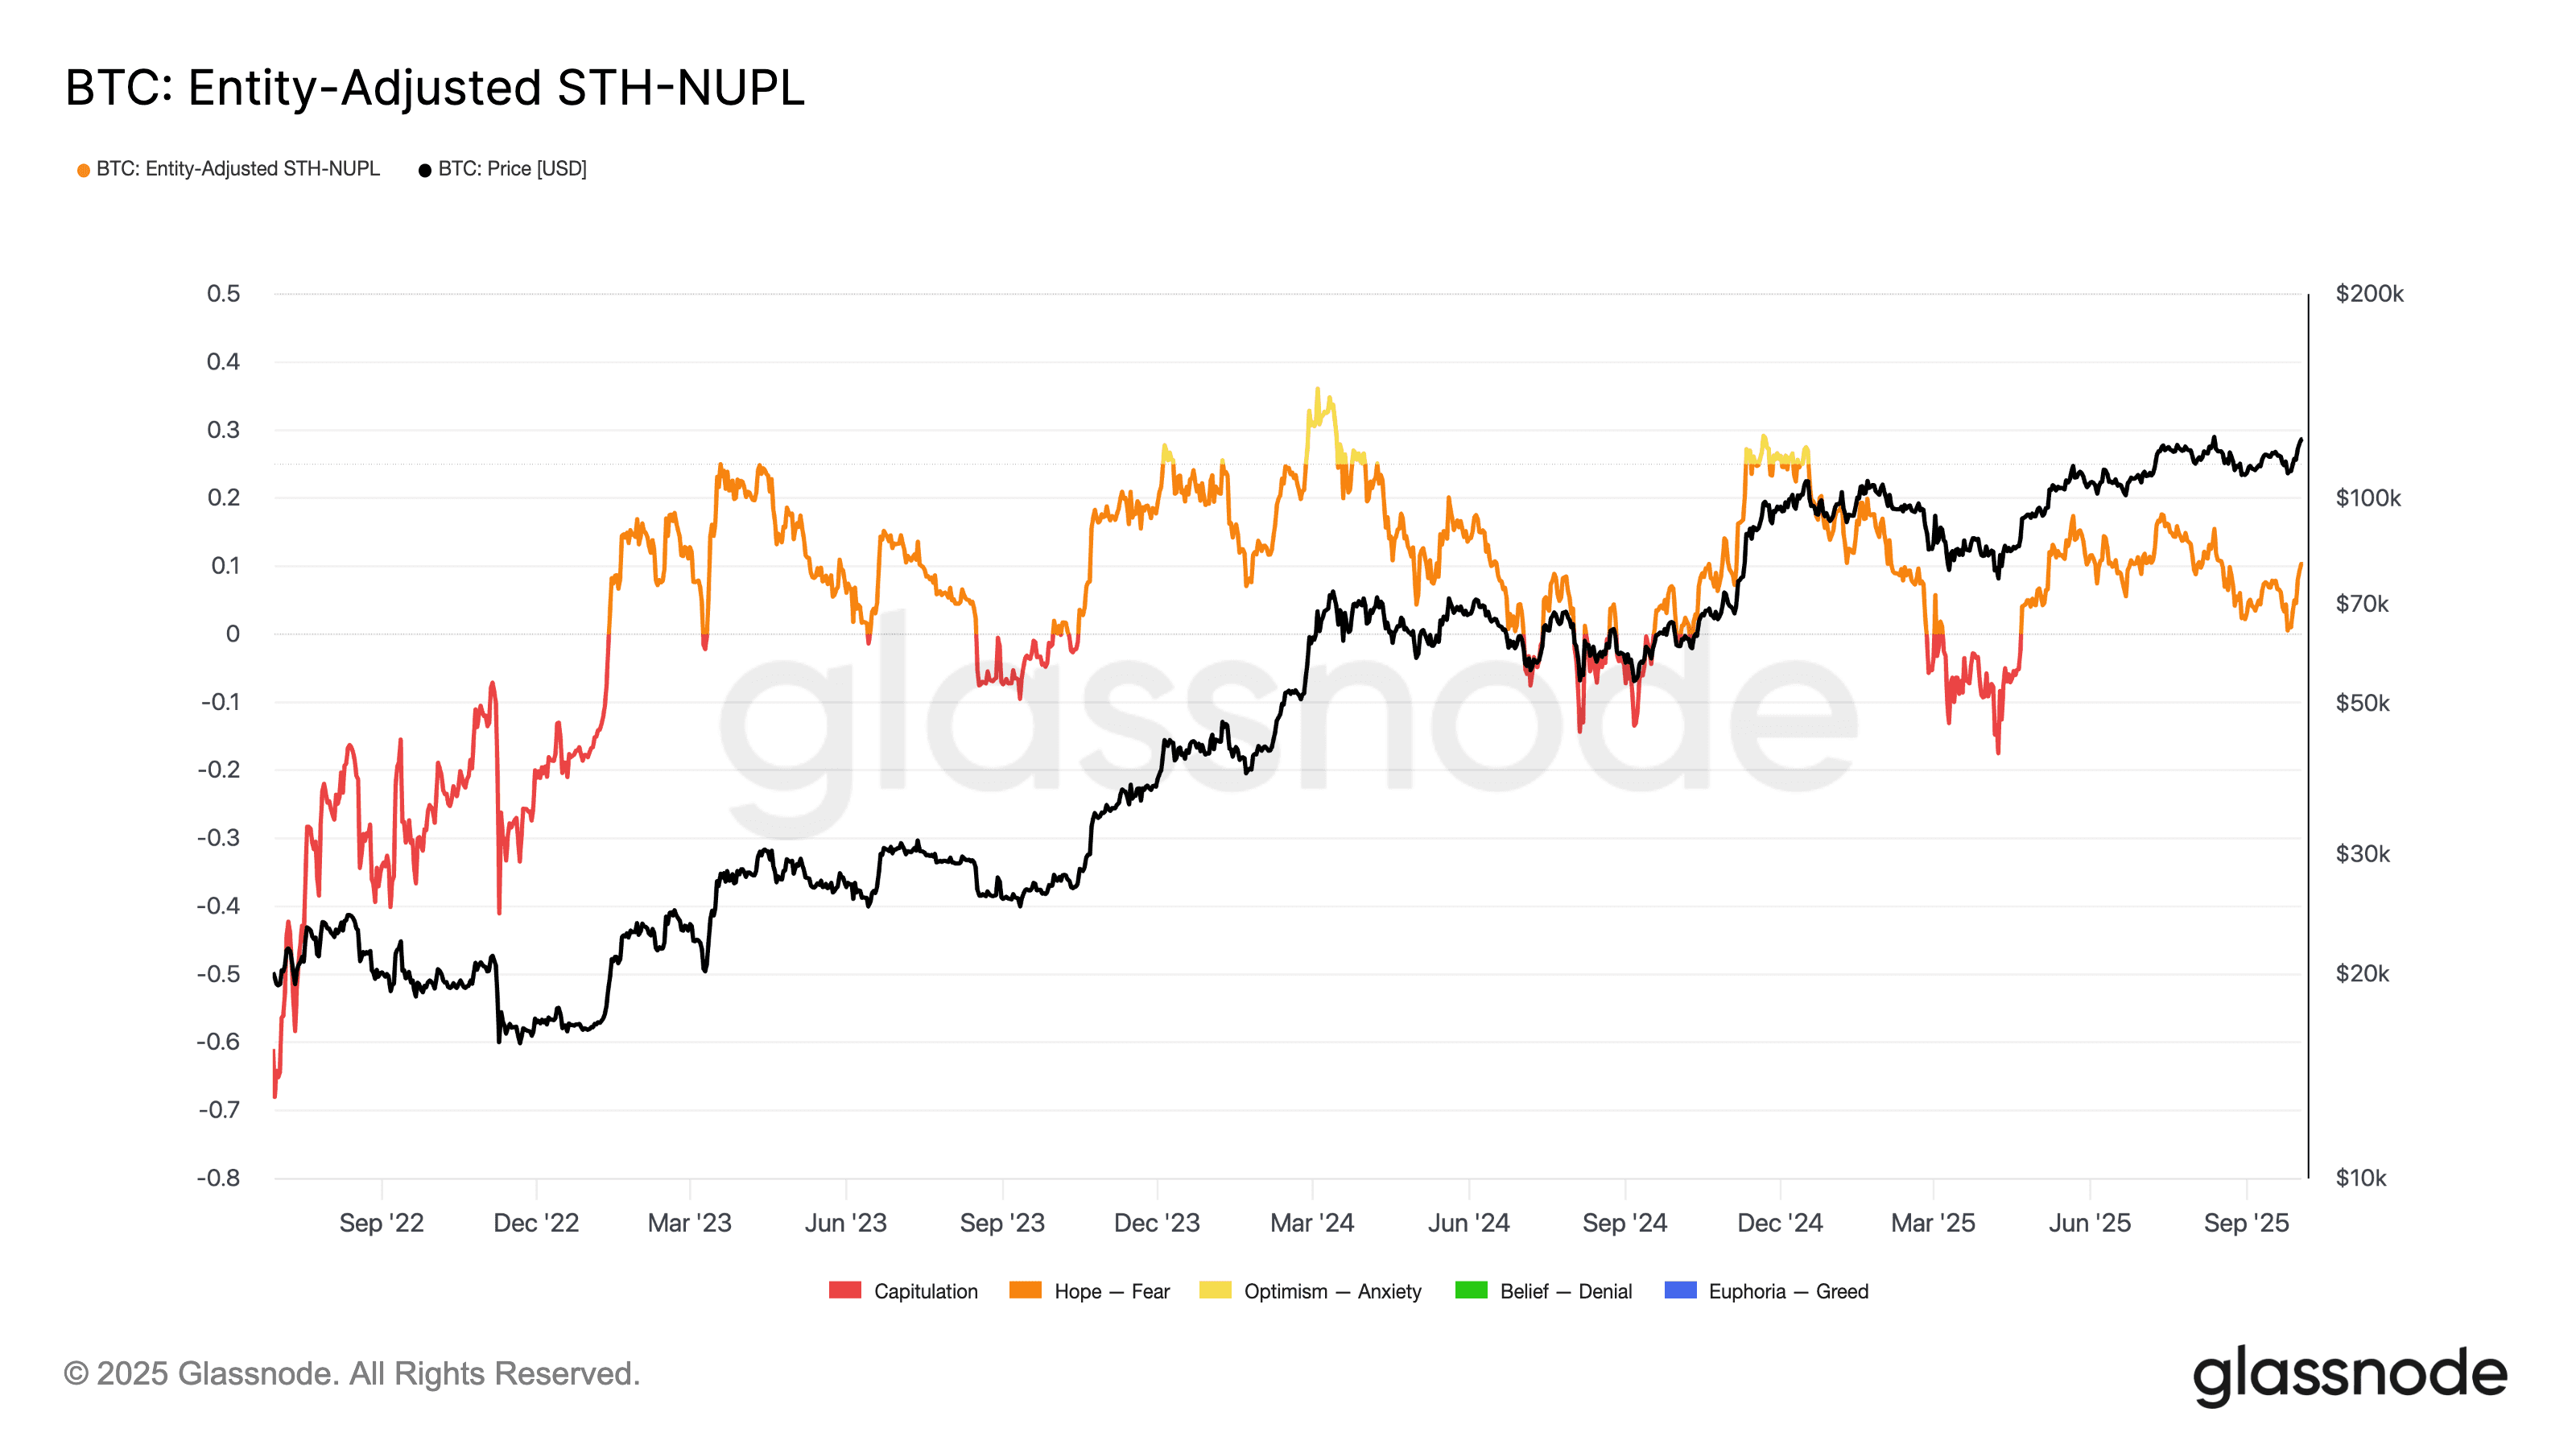
This metric captures the net unrealized profit or loss of Bitcoin held by short-term holders, defined as entities that acquired their coins within the last 155 days. It is calculated by comparing the current market value of short-term holder coins to their cost basis. Positive values indicate that these holders are sitting on unrealized profits, while negative values suggest they are underwater. Because short-term holders are more likely to react emotionally to price swings, this metric provides insight into speculative sentiment and can help identify local tops and bottoms in the market.
Short term holders maintained mostly positive unrealized balances through the quarter, with STH NUPL fluctuating modestly above 0. This shows that newer market participants continued to experience profits without the extremes of greed or fear that often lead to reversals. The stability of the indicator suggests that speculative sentiment remains constructive but contained, as quick profit takers have not overwhelmed demand. Historically, sustained periods of mildly positive readings have accompanied consolidation phases within broader uptrends, when new capital enters steadily but market participants avoid excessive risk taking.
Realized-Profit Loss Ratio
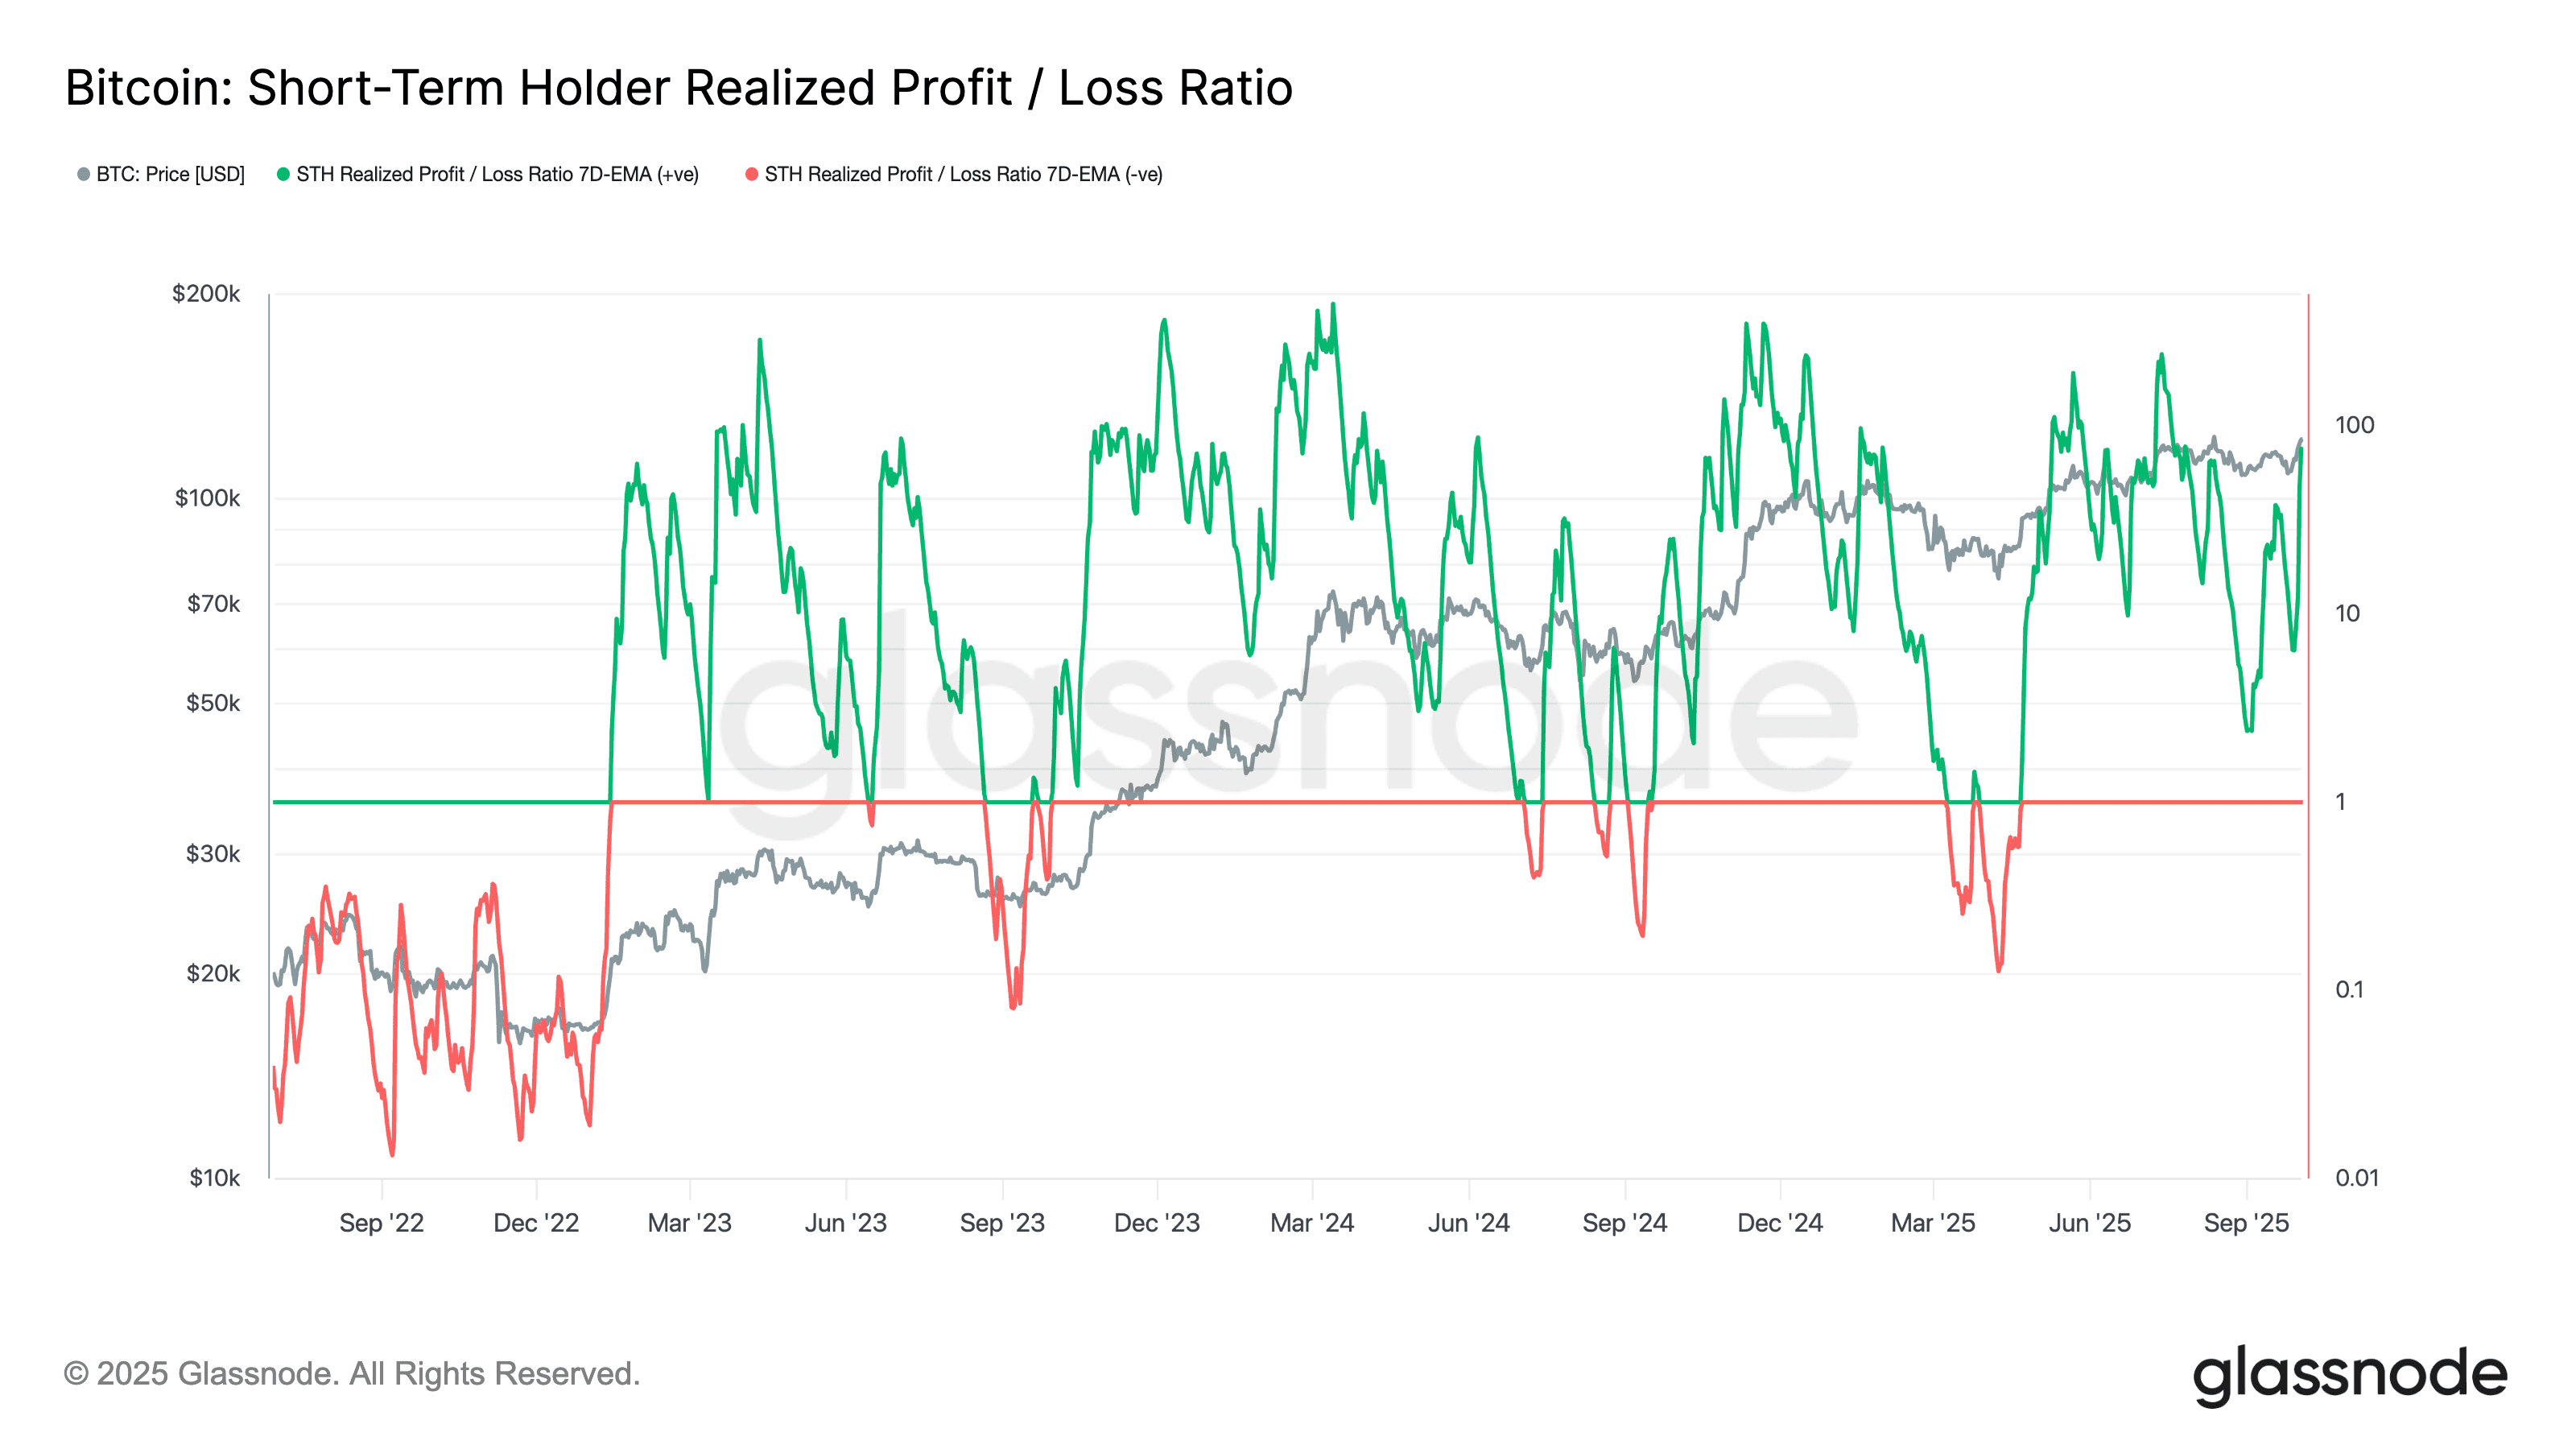
This metric measures the ratio between realized profits and realized losses for short-term holders (STHs), defined as addresses holding BTC for less than 155 days. A ratio above 1 means STHs are realizing more profit than loss, indicating a risk-on or bullish sentiment. A ratio below 1 signals more losses than profits, typically reflecting capitulation or a loss of confidence. Because short-term holders are more sensitive to price movements, this metric offers a real-time view of how speculative participants are behaving and how they are responding to prevailing market conditions.
Short-term holders maintained the ratio consistently above 1 through most of the quarter, confirming that realized activity remained dominated by profits and that confidence among newer participants stayed intact. The few temporary dips below parity were shallow and brief, indicating that downside moves were met with fast demand absorption. This pattern underscores the resilience of short term traders, whose behavior aligns with a constructive market tone rather than the fear driven reactions seen in weaker phases. Sustained profit realization within this cohort often coincides with healthy trending environments, where momentum is supported by active participation instead of speculative excess.
Short-Term Sentiment Commentary
Short-term sentiment during the quarter reflected a market that remained orderly and resilient despite elevated volatility. The Entity Adjusted STH NUPL showed that most recent buyers held modest unrealized profits, signaling optimism that was confident but not excessive. These newer participants continued to experience profitability without showing the rapid profit taking or panic selling typical of overheated markets. The Short Term Holder Realized Profit and Loss Ratio stayed consistently above one, confirming that realized activity remained dominated by gains and that short term participants continued to operate from a position of strength. Together, these measures indicate a healthy speculative environment where short term traders provide liquidity and momentum, but sentiment remains grounded in confidence rather than exuberance. The data points to a market that is functioning efficiently and absorbing volatility through steady participation rather than reactionary behavior.
05
Pricing Models
Bitcoin: Realized Price and MVRV
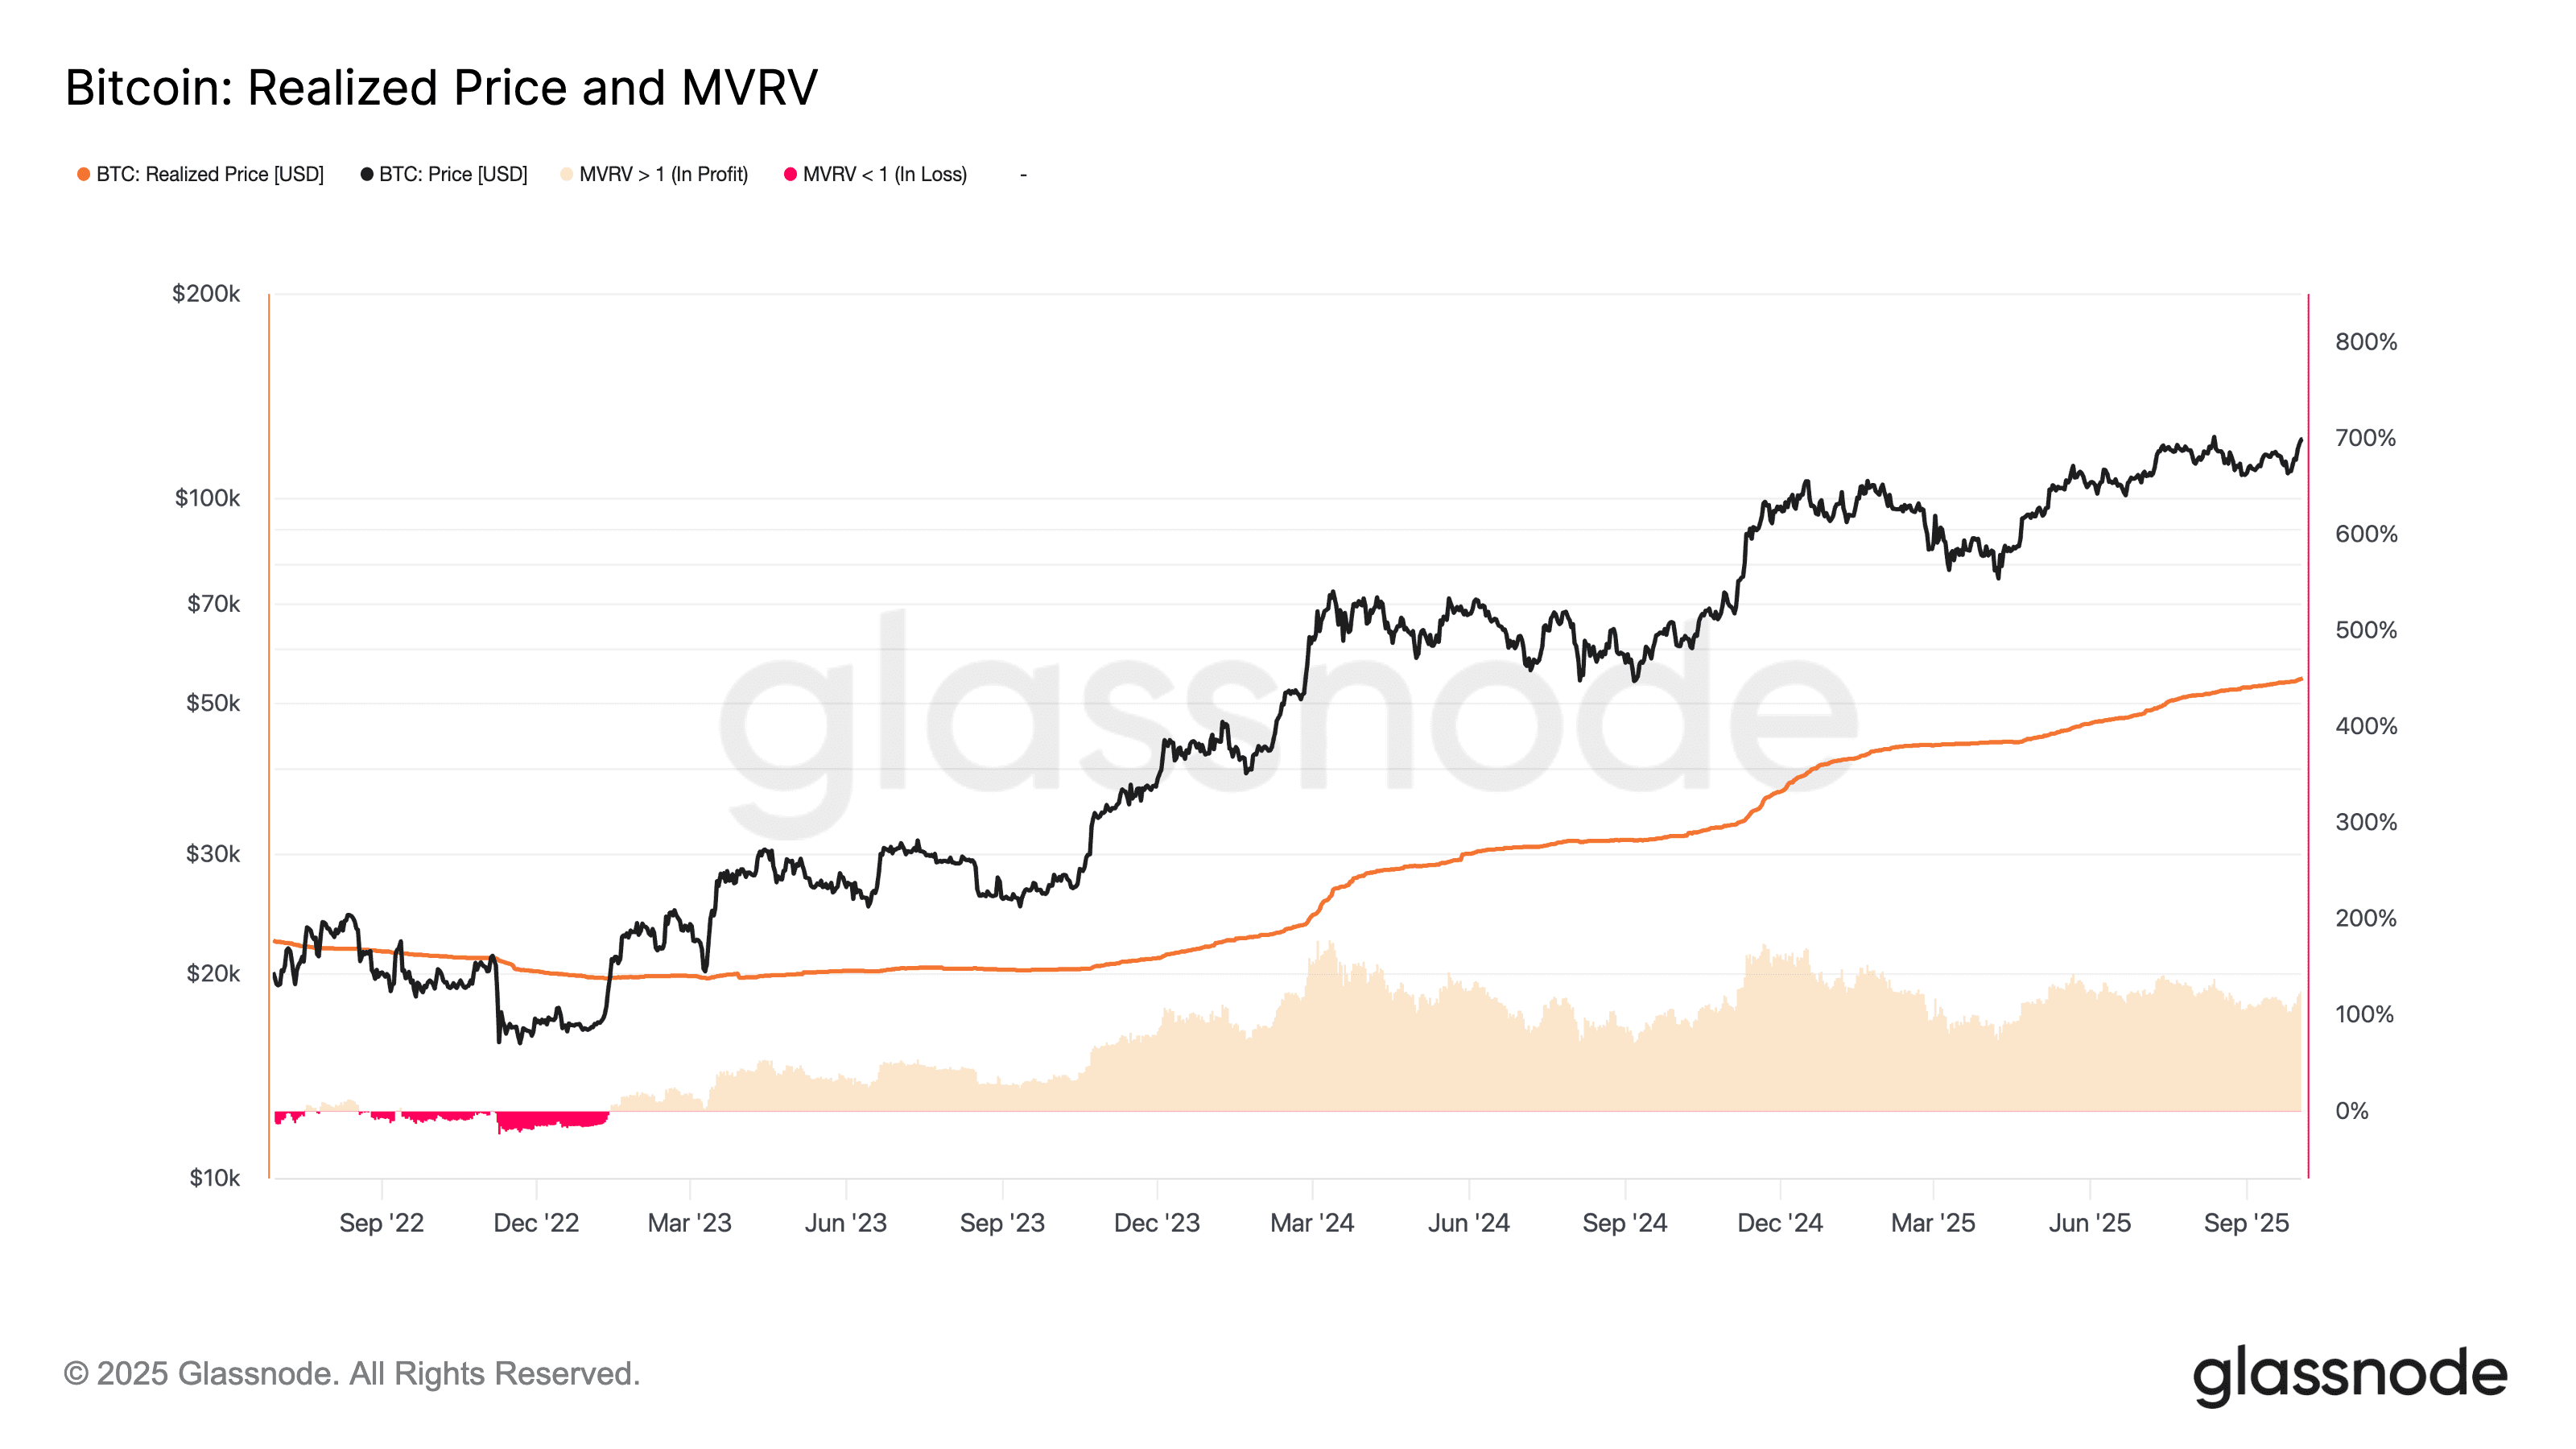
The Realized Price represents the average cost basis of the Bitcoin market and often acts as a foundation during periods of correction, while the MVRV ratio compares market value to that cost basis to gauge overall valuation extremes. MVRV values above 1 indicate that the market is, on average, in profit, while readings above 2.5 have historically coincided with overheated conditions and cycle tops. Together, these metrics illustrate how far market pricing has moved from its aggregate cost structure and help identify periods of either undervaluation or excess.
Market price remained comfortably above the Realized Price throughout the quarter, reflecting a sustained margin of profitability and suggesting that aggregate cost support sits well below prevailing levels. The MVRV ratio held within a moderate range between roughly 1.5 and 2, consistent with an environment of healthy optimism rather than speculative exuberance. This equilibrium implies that while investors are operating from a position of profit, valuation metrics have not yet reached levels that typically trigger widespread profit taking. The data points to a market that is fundamentally strong and well anchored, with sentiment supportive of continued growth but tempered enough to avoid the risk signals associated with overheated conditions.
Bitcoin: Long-Term vs Short-Term Holder Cost Basis
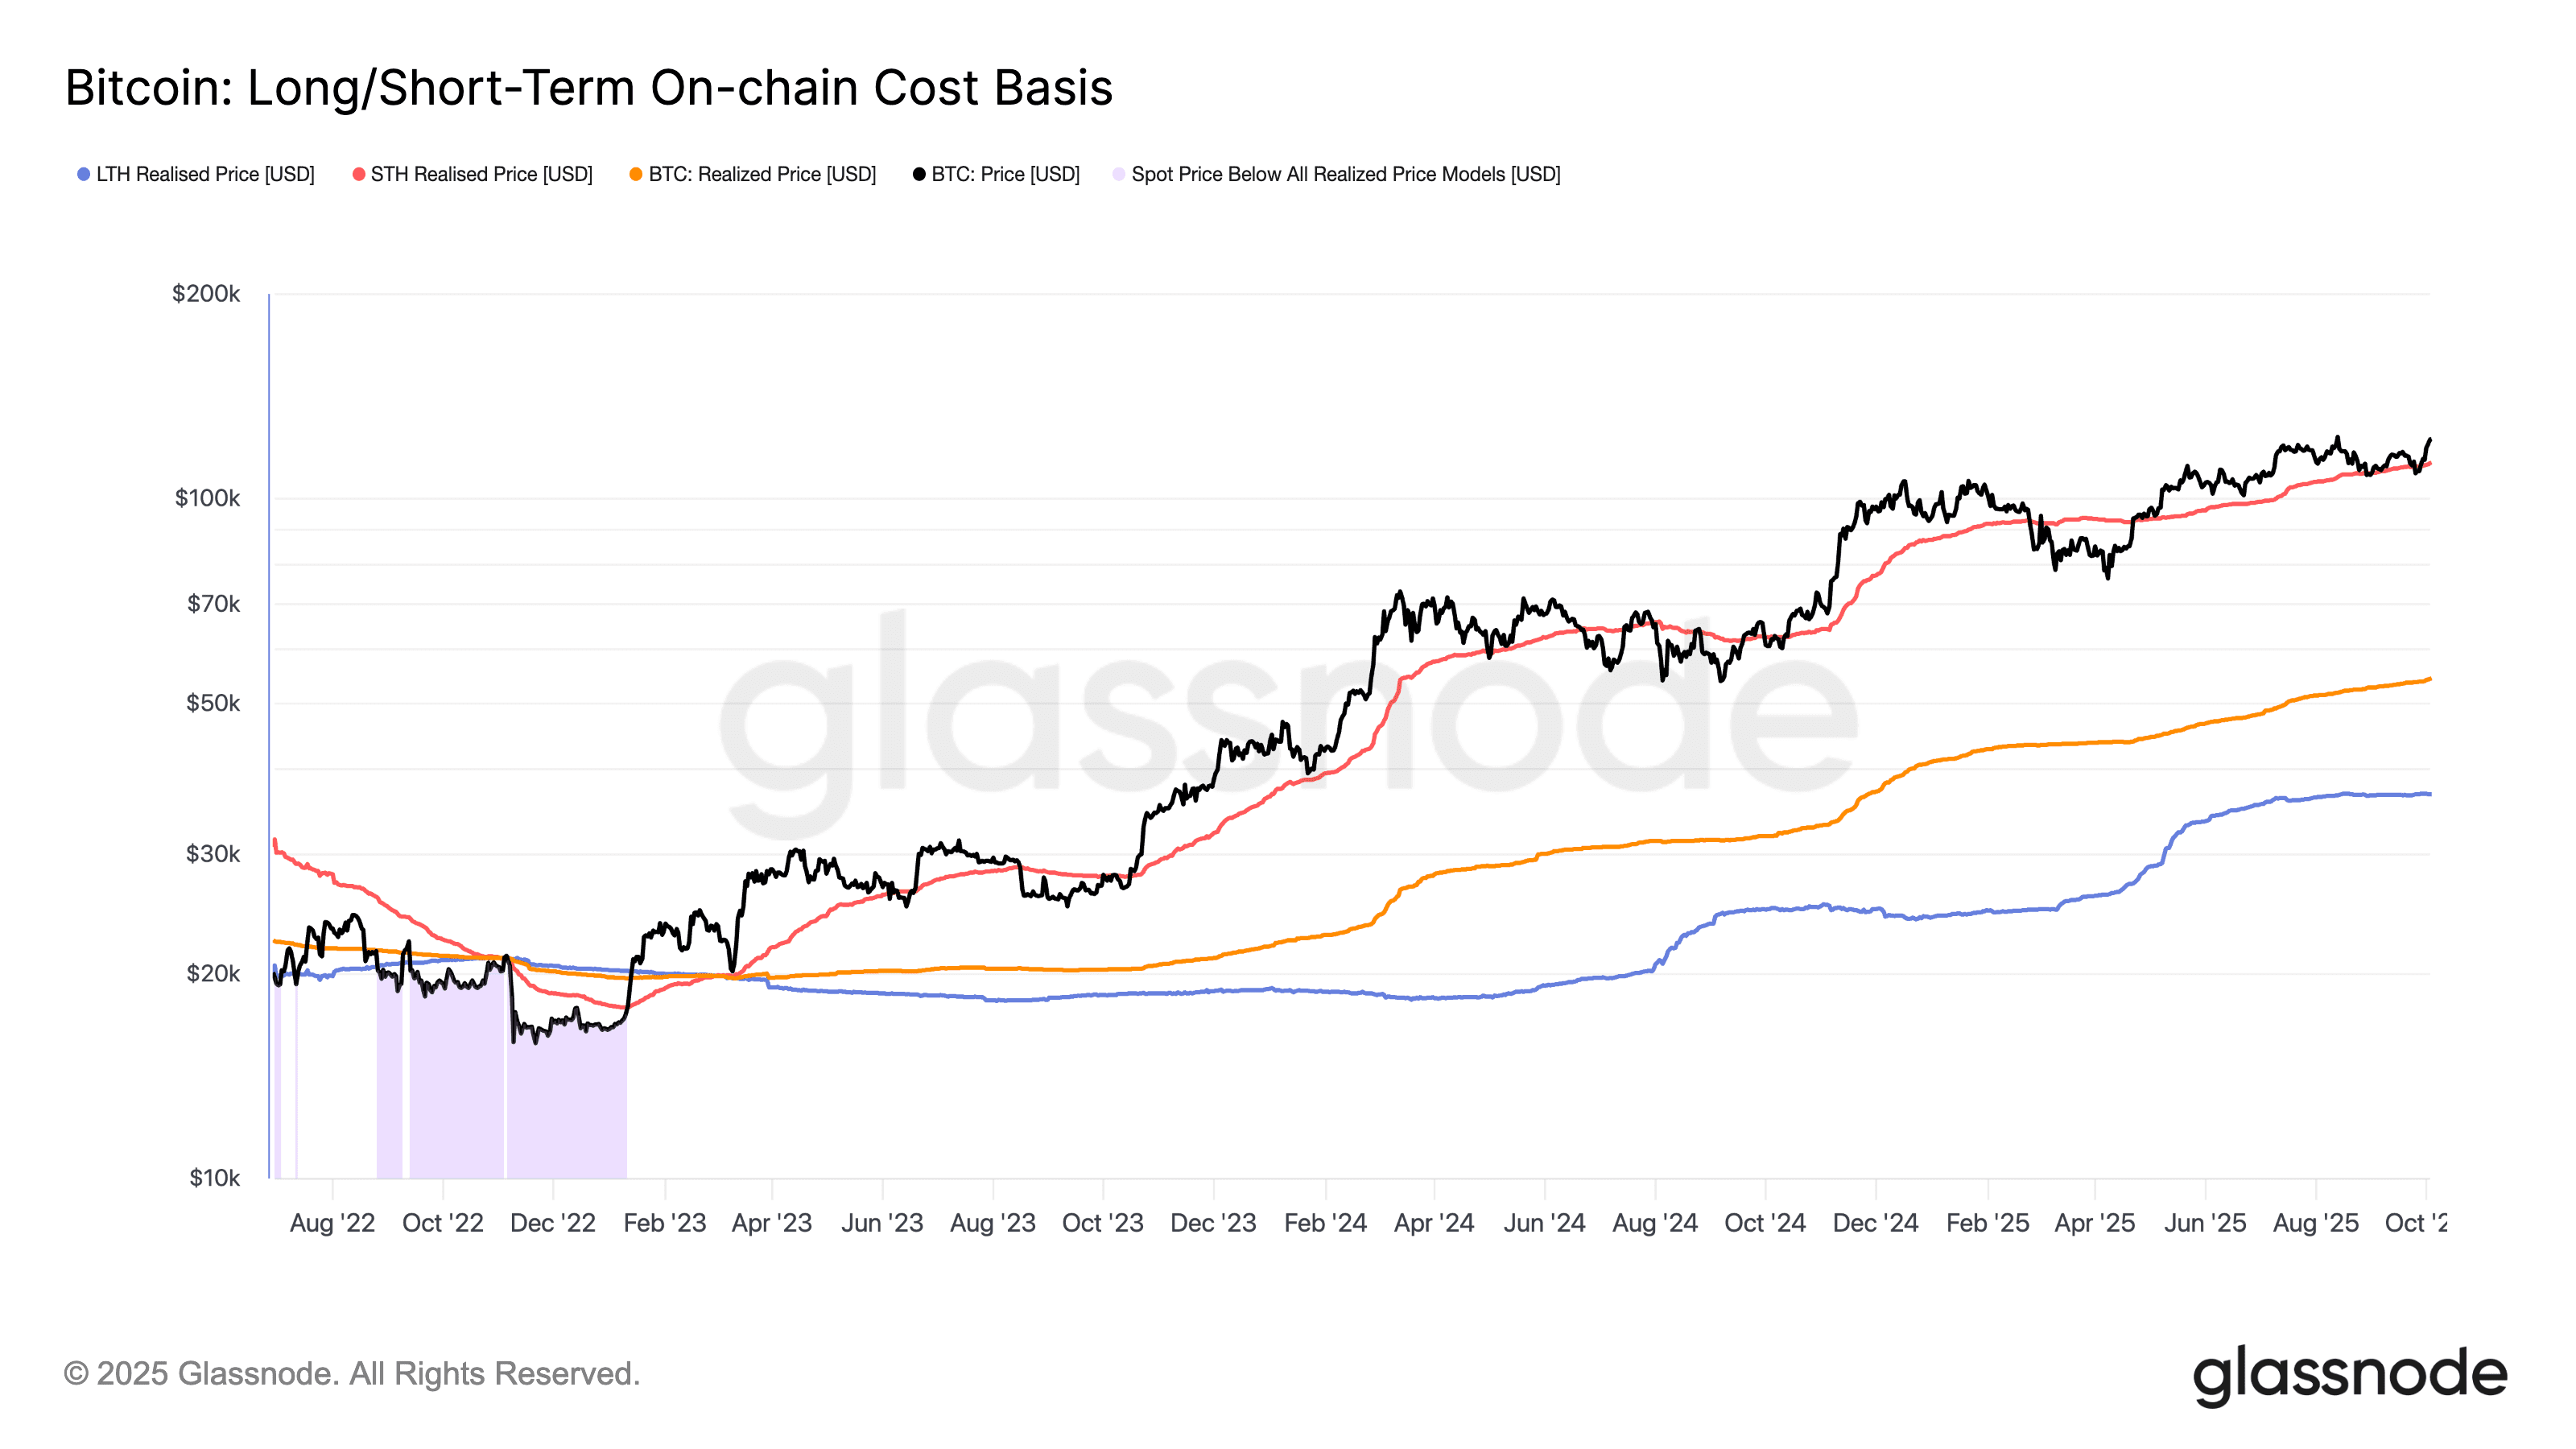
The Long/Short-Term Holder Cost Basis model compares the average purchase price of two distinct investor groups. Long-term holders (LTHs), who have held their Bitcoin for more than 155 days, typically represent market conviction and macro support levels, while short-term holders (STHs), who acquired coins within the past 155 days, reflect more reactive and speculative sentiment. When the current price trades above the STH cost basis, it signals that recent investors are in profit, which often correlates with bullish momentum. Conversely, when the price falls below the STH cost basis, it indicates newer buyers are underwater and may panic sell. Meanwhile, the LTH cost basis tends to act as a strong floor in bear markets, rarely breached unless under extreme stress.
Throughout the quarter, Bitcoin’s market price remained comfortably above both the long term and short term holder cost basis, a structure that signals coordinated profitability across cohorts and a strong underlying market foundation. The widening spread between the two groups highlights the continued strength of long term conviction, with seasoned investors maintaining positions well below the current market level while newer participants are holding in profit. Historically, this configuration has aligned with healthy expansionary phases in the cycle, where capital from short term participants is absorbed and secured by long term holders, providing a stable base for continued appreciation.
Pricing Model Commentary
Bitcoin’s pricing structure through the quarter remained stable and aligned with a maturing phase of the cycle. The Realized Price and MVRV framework showed that the market continues to trade comfortably above its aggregate cost basis, with profitability broadly distributed and valuations still well below overheated thresholds. The Long and Short Term Holder Cost Basis model reinforced this picture of balance, as both cohorts remained in profit and the wide spread between their cost bases signaled that the market is still mid-cycle rather than nearing exhaustion. Together, these models indicate that Bitcoin’s valuation is anchored in healthy cost alignment across investor groups, where profitability is sustained but tempered. The data suggests a market supported by long-term conviction and structural stability, offering room for continued appreciation without the speculative excess that often characterizes late-cycle conditions.
06
News
Bitcoin Mining

“CoreWeave to Acquire Core Scientific in $9 Billion All Stock Transaction”
CoreWeave and Core Scientific announced a definitive agreement on July 7, 2025, for CoreWeave to acquire Core Scientific in an all stock transaction valued at approximately $9 billion. Under the terms, Core Scientific stockholders will receive 0.1235 newly issued shares of CoreWeave Class A common stock for each share held, representing a 66% premium to the unaffected closing price. The acquisition gives CoreWeave ownership of approximately 1.3 GW of gross power across Core Scientific's national data center footprint, with an incremental 1 GW plus of potential gross power available for expansion.
“Bitcoin Mining Difficulty Reaches All Time High as Solo Miners Defy Odds”
Bitcoin mining difficulty climbed to a new all time high of 134.7 trillion in September 2025, defying projections that network difficulty would decrease and creating tighter operating conditions for mining firms in an already competitive industry running on narrow profit margins. The hashrate had previously reached over 1 trillion hashes per second on August 4 before declining to 967 billion hashes per second. Despite increasing dominance by large institutional players, three solo miners successfully mined blocks in July and August through the Solo CK pool, claiming block rewards valued at approximately $350,000 to $373,000 each.


“Bitfarms Announces Share Buyback Program Amid HPC/AI Expansion”
Bitfarms announced on July 22, 2025, a corporate share buyback program authorizing the repurchase of up to 49.9 million shares, representing 10% of its common stock's public float, over a 12 month period beginning July 28. CEO Ben Gagnon stated the buyback reflects the company's belief that shares are undervalued, with the Bitcoin business underappreciated by the market and little to no value being associated with HPC potential. The company emphasized its unique energy portfolio in Pennsylvania will drive long-term sustainable growth while pursuing opportunities in HPC/AI infrastructure.
News Commentary
The Bitcoin mining industry's strategic pivot toward AI and high performance computing intensified this quarter as operators responded to compressed margins and rising network difficulty. CoreWeave's $9 billion acquisition of Core Scientific represents the largest consolidation in the sector's history, with the AI cloud infrastructure company recognizing the value of repurposing mining data centers for HPC workloads while eliminating $10 billion in future lease obligations and securing critical power capacity. The network's difficulty reaching an all time high of 134.7 trillion, despite projections of a decrease, underscores both the unpredictability of difficulty adjustments and the relentless competitive pressure driving long-term upward trends as more efficient hardware continues coming online. Bitfarms' explicit acknowledgment that the market undervalues their Bitcoin operations relative to their energy infrastructure's HPC/AI potential mirrors the broader CoreWeave transaction, signaling a fundamental industry shift where public mining companies are increasingly positioning their power capacity and data center assets for alternative use cases that promise higher margins than pure play Bitcoin mining. As large public miners redirect capital and infrastructure toward AI opportunities, this pivot may create space for dedicated mid-sized mining operators to capture market share and strengthen their position in the Bitcoin mining ecosystem, particularly those with efficient operations and access to low cost power who remain committed to pure play mining strategies.
07
Mining Dashboard
Bitcoin: Difficulty per Issuance Pricing Model
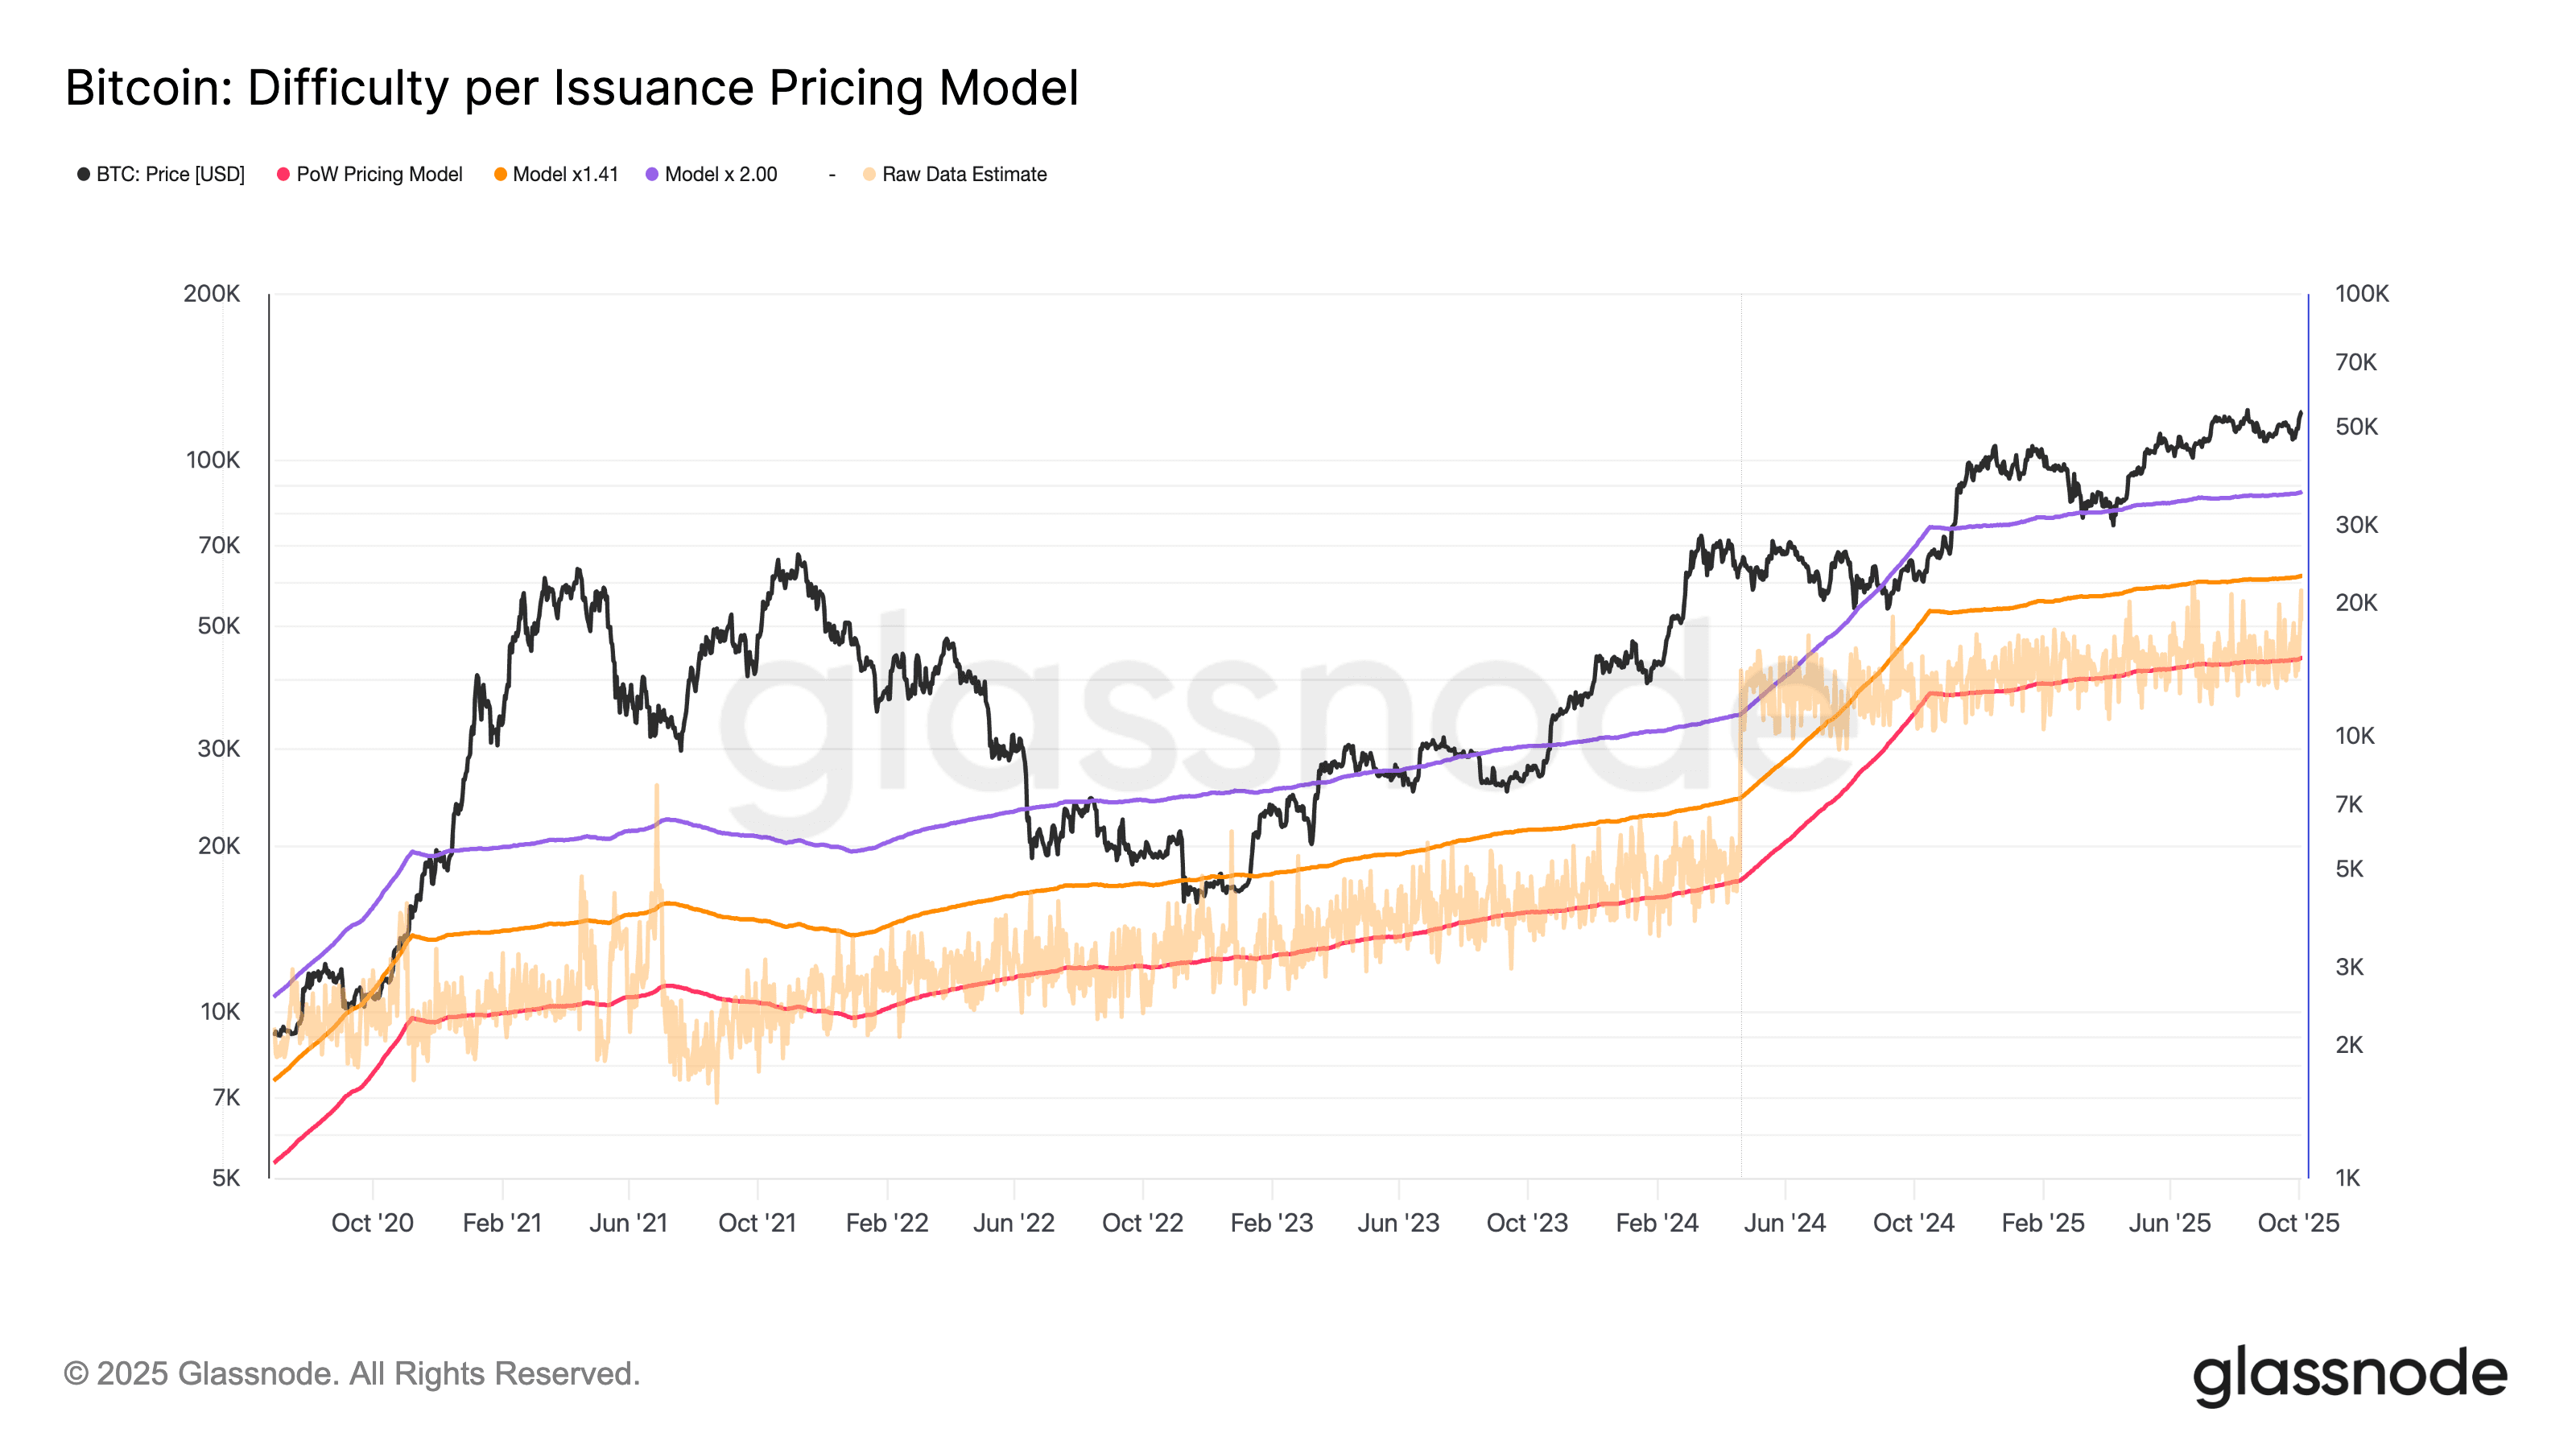
The Difficulty per Issuance Pricing Model is a miner-centric valuation tool that establishes a lower bound estimate for Bitcoin’s fair value by combining two key variables: network difficulty and issuance rate. Difficulty reflects the computational effort required to mine blocks, serving as a proxy for capital investment and network security. Issuance refers to the number of new BTC created through mining, which diminishes over time as halvings occur. This model uses a smoothed average of difficulty and adjusts for reduced issuance, yielding a dynamic cost-floor estimate that reflects the production pressures on miners. As difficulty rises and issuance drops, the modeled price increases, anchoring the long-term market structure to miner behavior and economic feasibility.
During the third quarter of 2025, Bitcoin’s spot price traded well above all modeled production cost bands, maintaining an average of roughly $110,000 against modeled base levels between $22,000 and $45,000. The difficulty component of the model increased by approximately 5.8% quarter-over-quarter, in line with the broader rise in global hashrate capacity. The distance between spot and modeled floors remained wide, averaging around 2.4x above the 1.41x band and 1.7x above the 2.0x band, underscoring that miner margins, while compressed by lower hashprice levels, are still positive. This configuration reflects a market where price continues to command a strong premium over modeled production costs, confirming that the current cycle remains comfortably within an economically sustainable range for miners and reinforcing the structural resilience of Bitcoin’s valuation framework.
BTC: Percent Miner Revenue from Fees
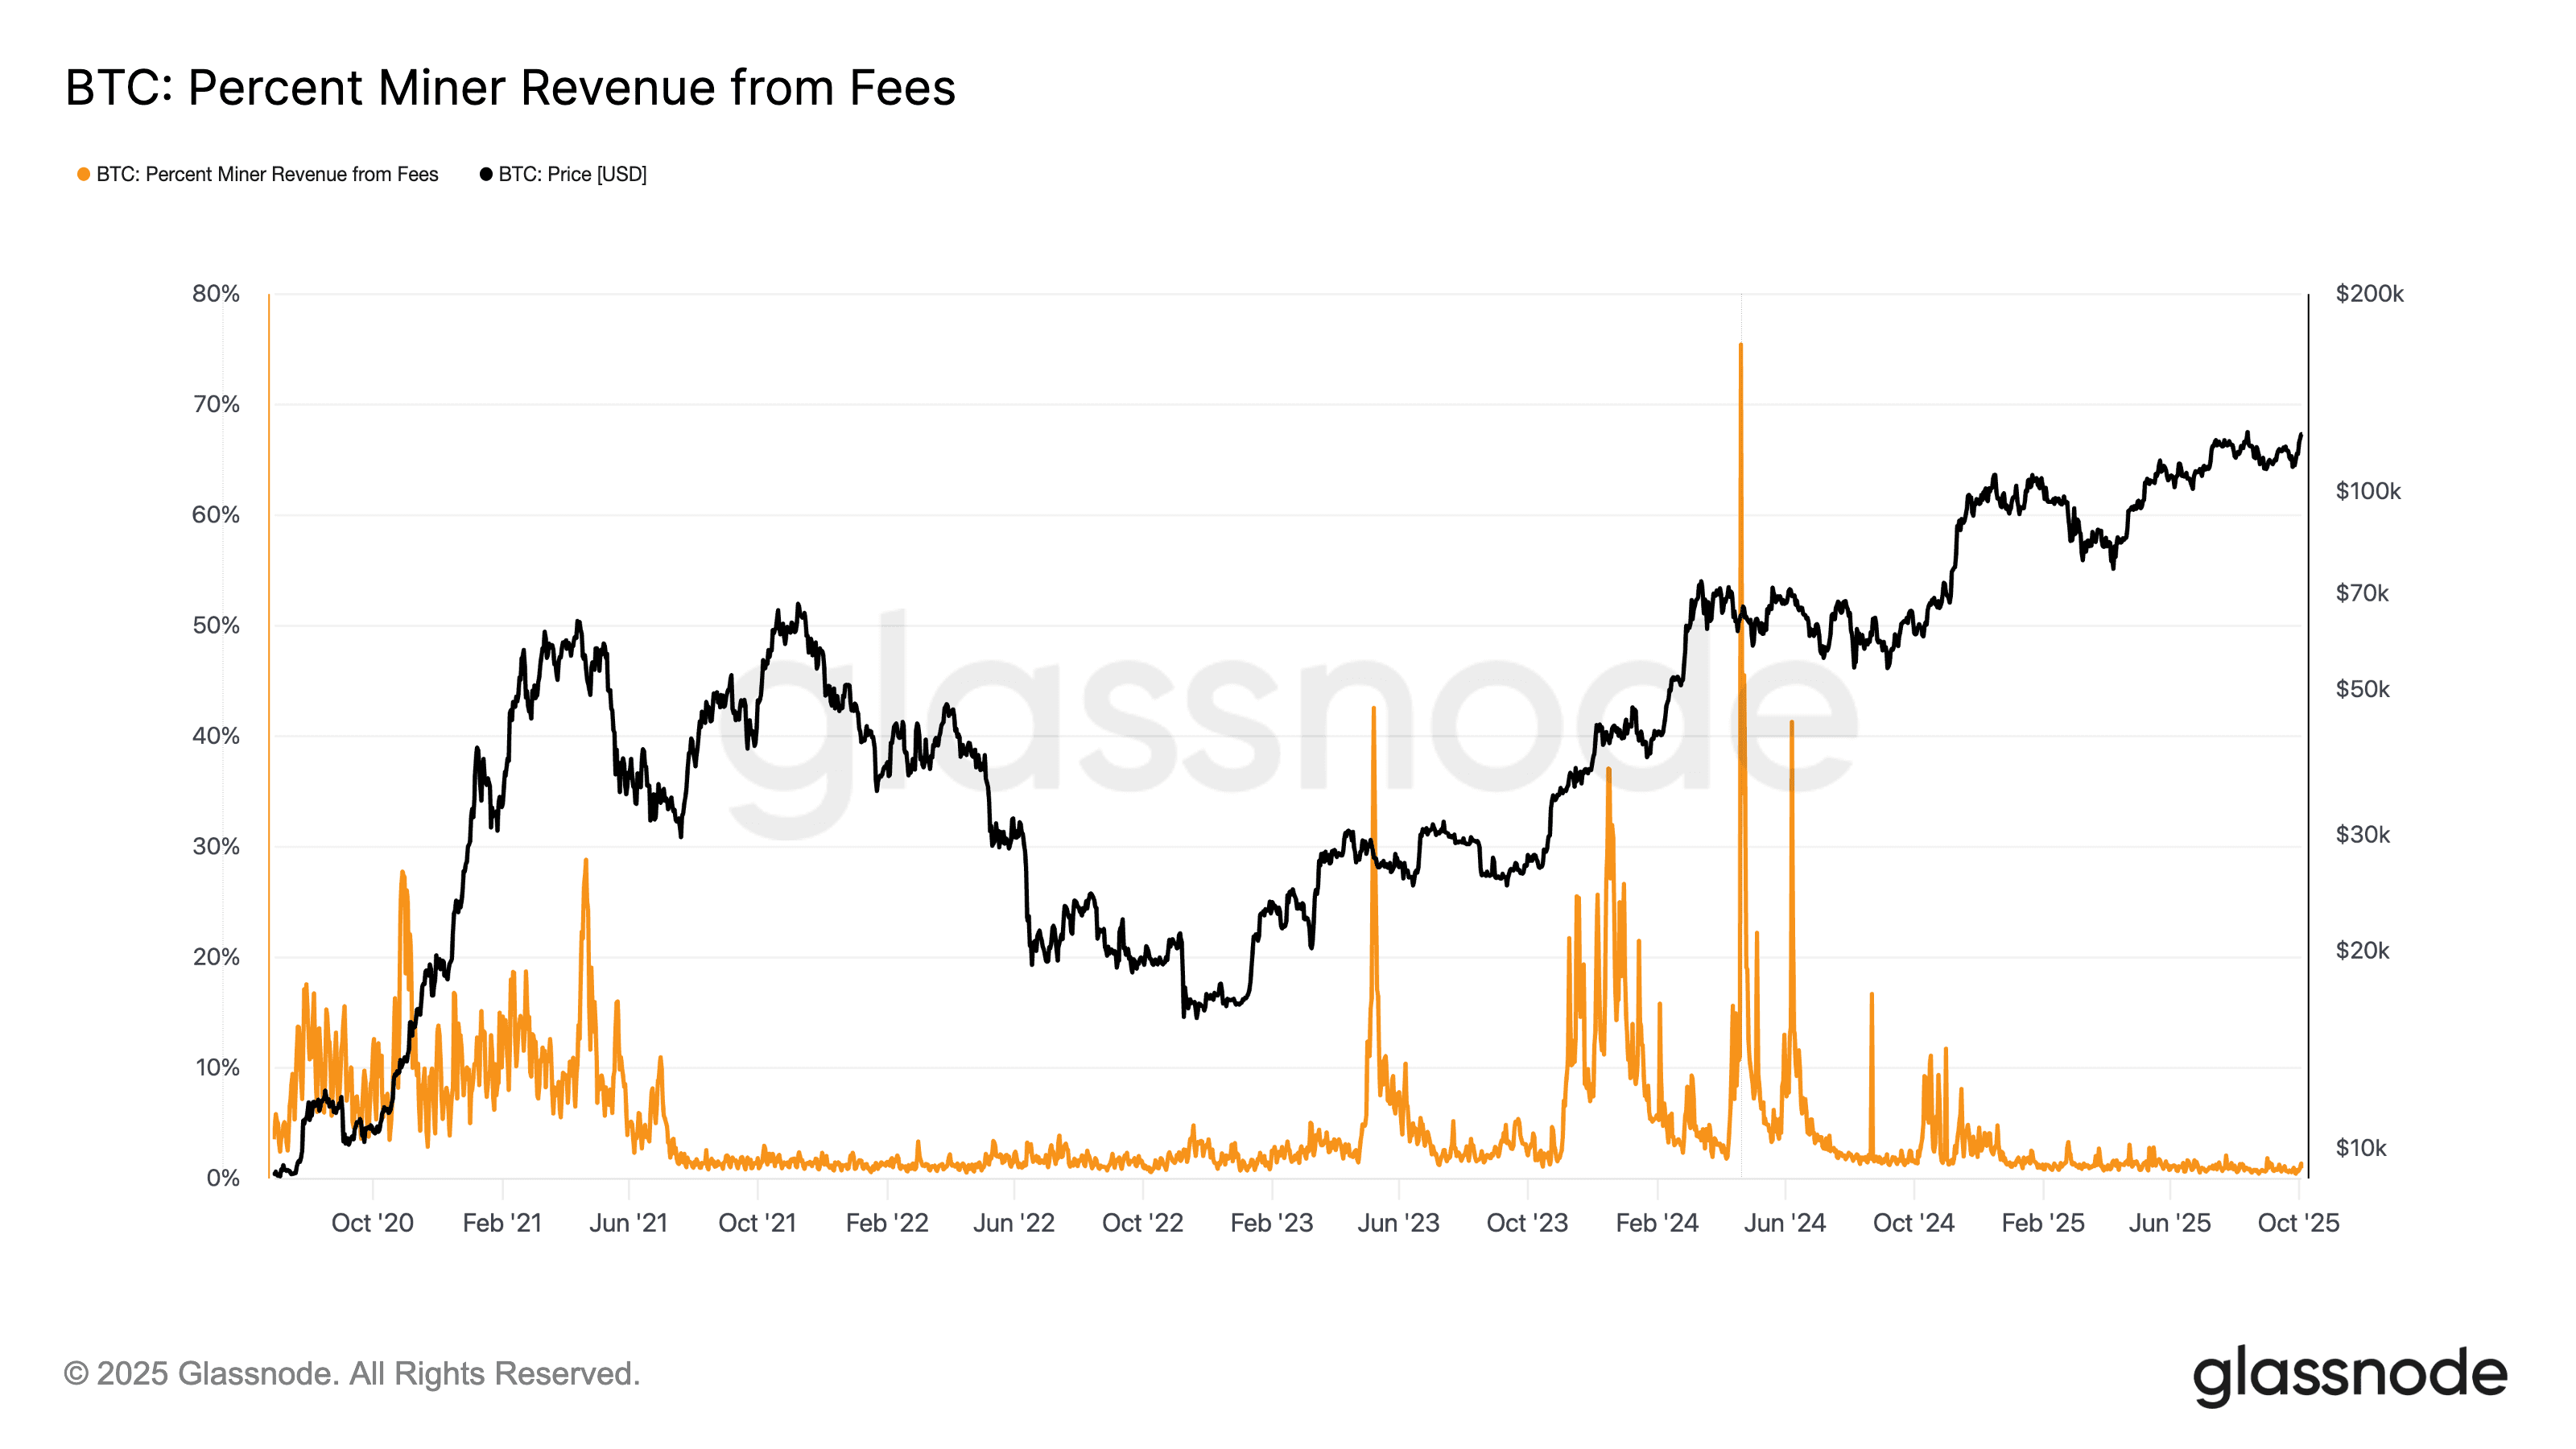
The Percent Miner Revenue from Fees metric measures what share of total miner income comes from transaction fees rather than block rewards. While block subsidies currently make up the majority of miner compensation, fees become increasingly important over time as halvings reduce issuance. This metric offers a clear signal of network activity, reflecting the real-time demand for transaction settlement on the Bitcoin blockchain. Higher fee percentages indicate congestion and user willingness to pay for priority, often aligning with market speculation or heightened on-chain utility. In contrast, lower values typically reflect subdued transactional demand and less urgency in the network, often seen during bear markets.
During the third quarter of 2025, miner revenue derived from fees averaged between 1.2% and 2.0%, representing one of the lowest sustained levels since the start of the year. Transactional demand remained moderate even as Bitcoin’s price stabilized around $110,000, with few instances of fee spikes or congestion. This low fee contribution reflects an efficient and uncongested network environment, supported by improved transaction batching and growing use of layer-two settlement solutions such as the Lightning Network.
BTC: Miner Net Position Change
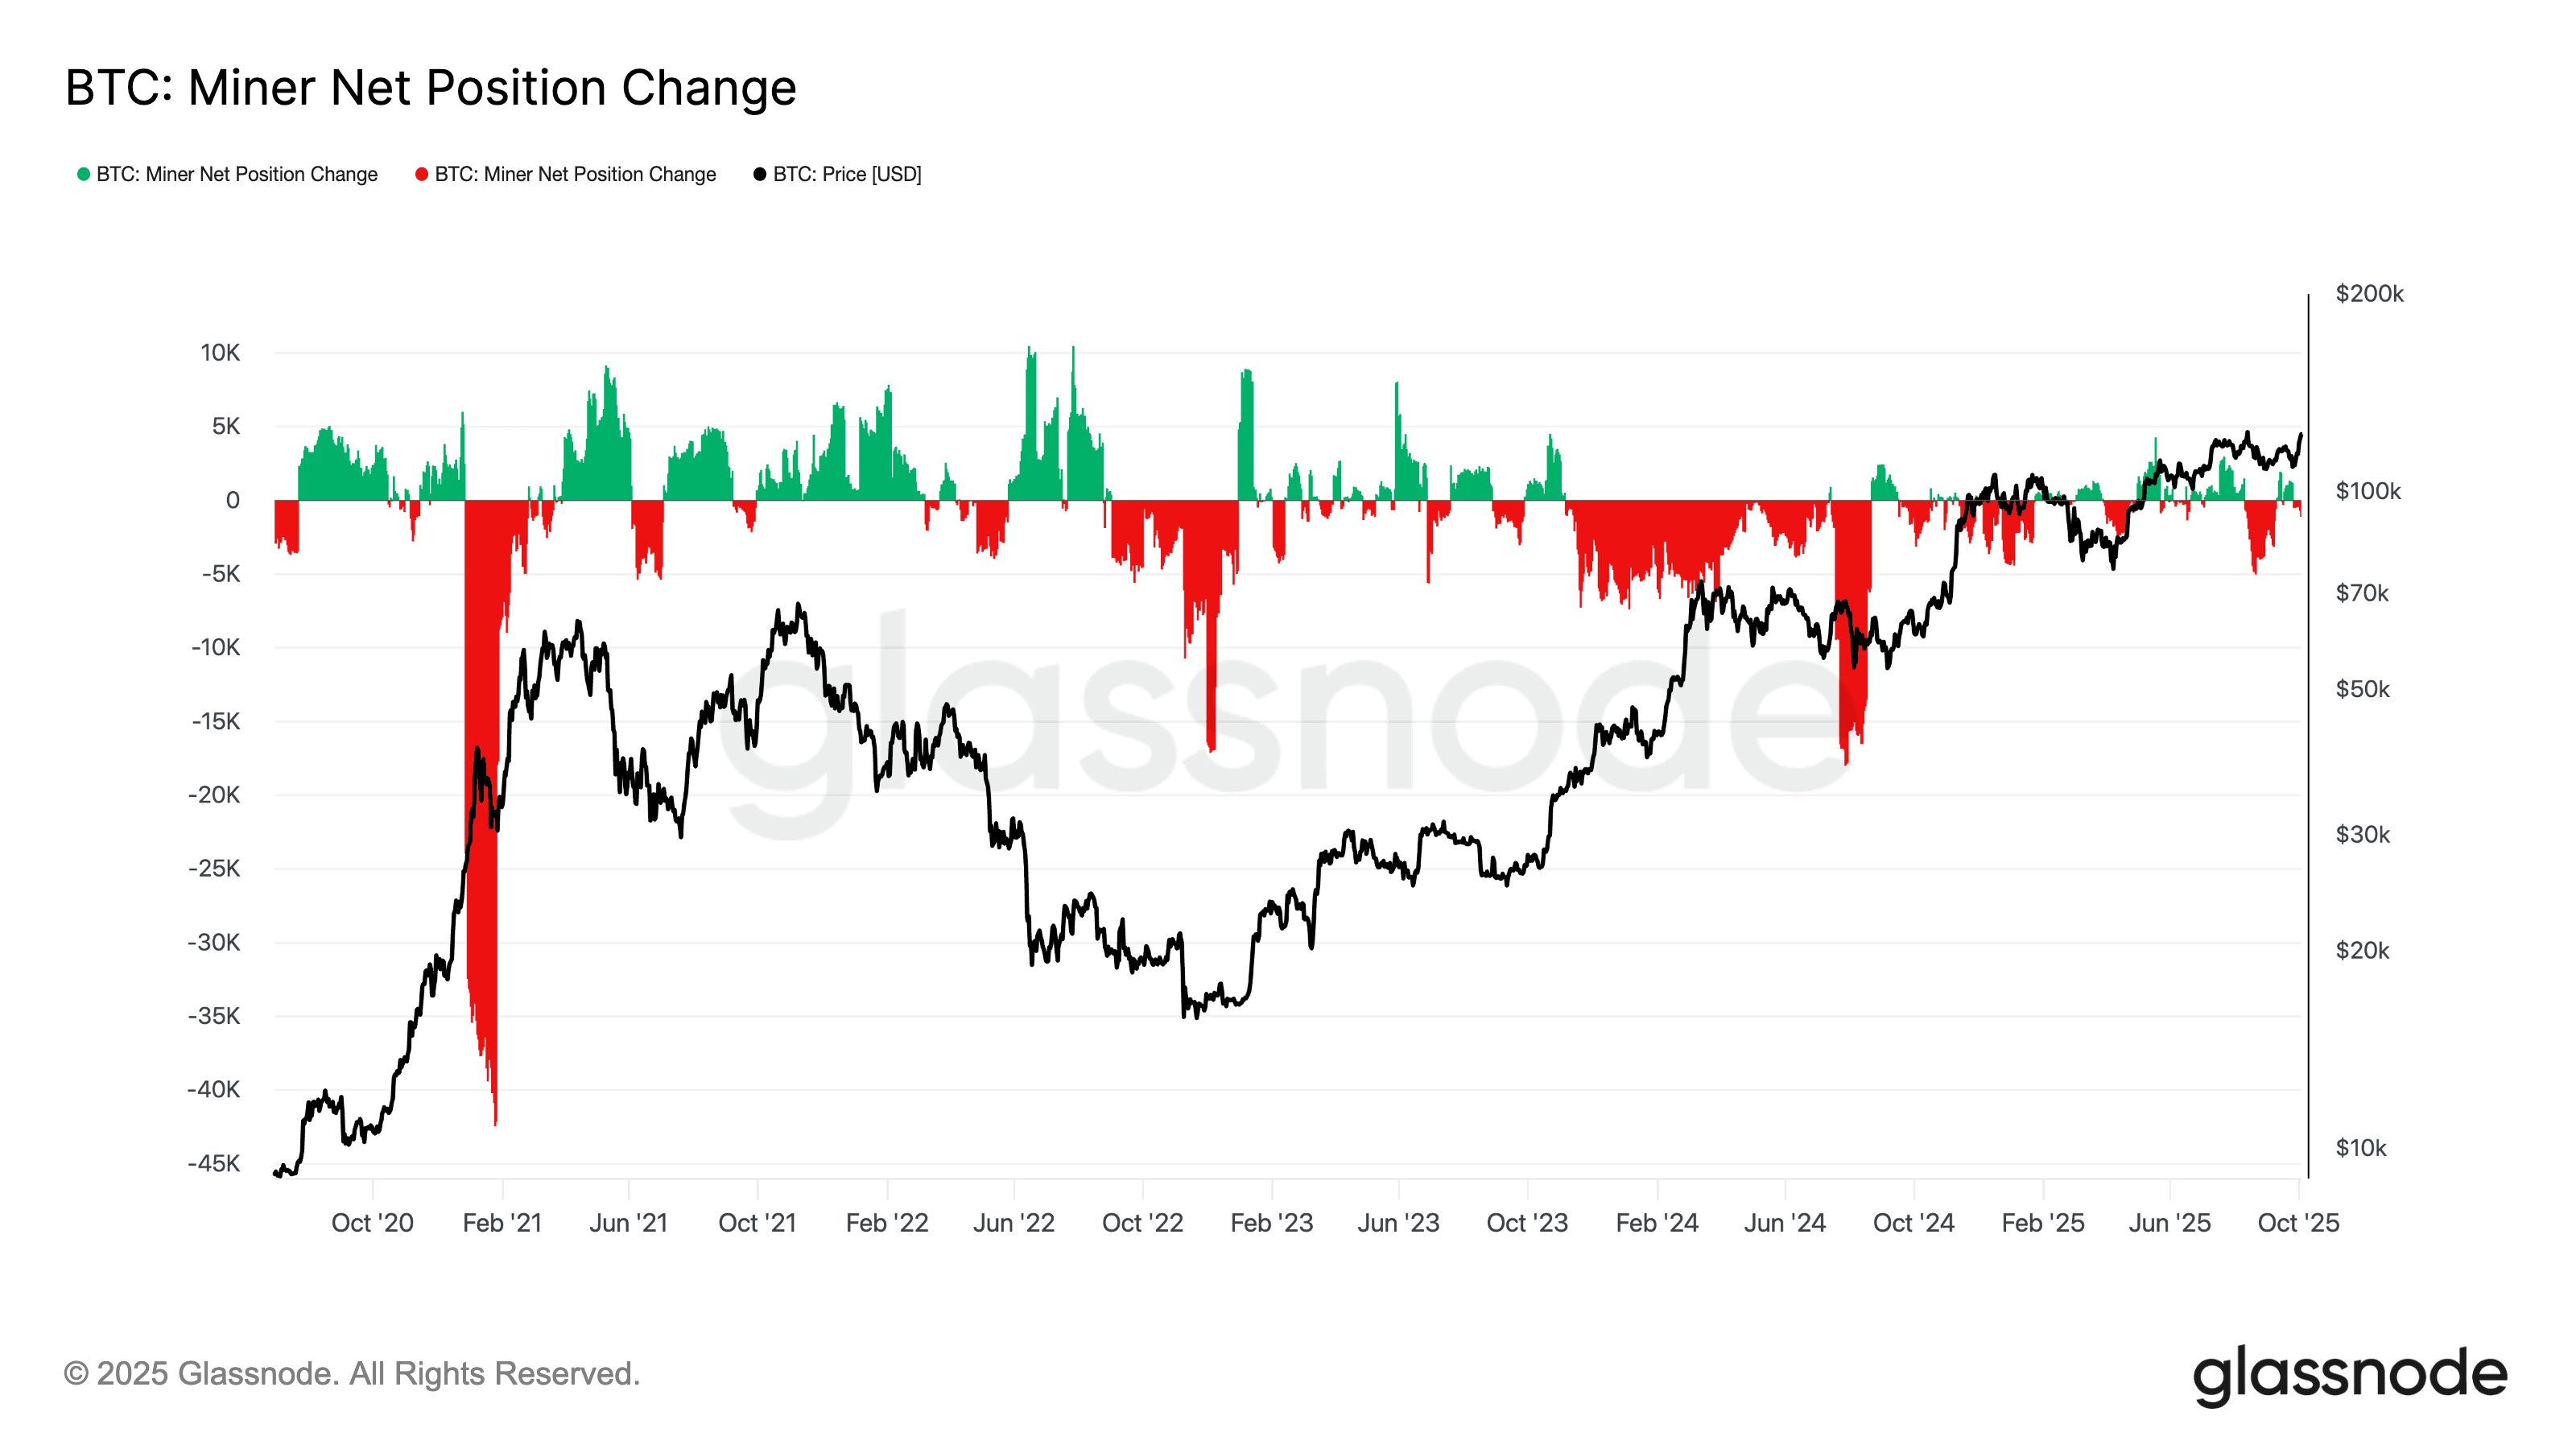
The Miner Net Position Change metric captures the 30-day rolling change in the Bitcoin balances of miner wallets. A positive value suggests miners are accumulating BTC, either by holding newly mined coins or withdrawing fewer from treasury. A negative value reflects distribution, typically selling to meet operational costs or capitalize on favorable prices. As miners are a consistent source of natural sell pressure, their behavior offers critical insight into macro supply dynamics. Accumulation implies long-term confidence and reduced immediate sell pressure, while distribution can create headwinds during uptrends or signal underlying stress during drawdowns.
Throughout the third quarter of 2025, miner balances showed a mixed but slightly negative bias, with periodic waves of moderate distribution following brief accumulation phases. Net outflows averaged between 1,000 and 3,000 BTC per month, modest compared with prior peaks in selling pressure. This pattern suggests that while miners continue to realize profits to fund operations amid higher difficulty and compressed hashprice levels, the scale of distribution remains controlled. The limited magnitude of net selling indicates that most miners are managing treasury strategies prudently rather than engaging in distress liquidation, consistent with a stable macro environment and sustained confidence in long-term profitability.
BTC: ASIC Rig Profitability (Avalon A15)
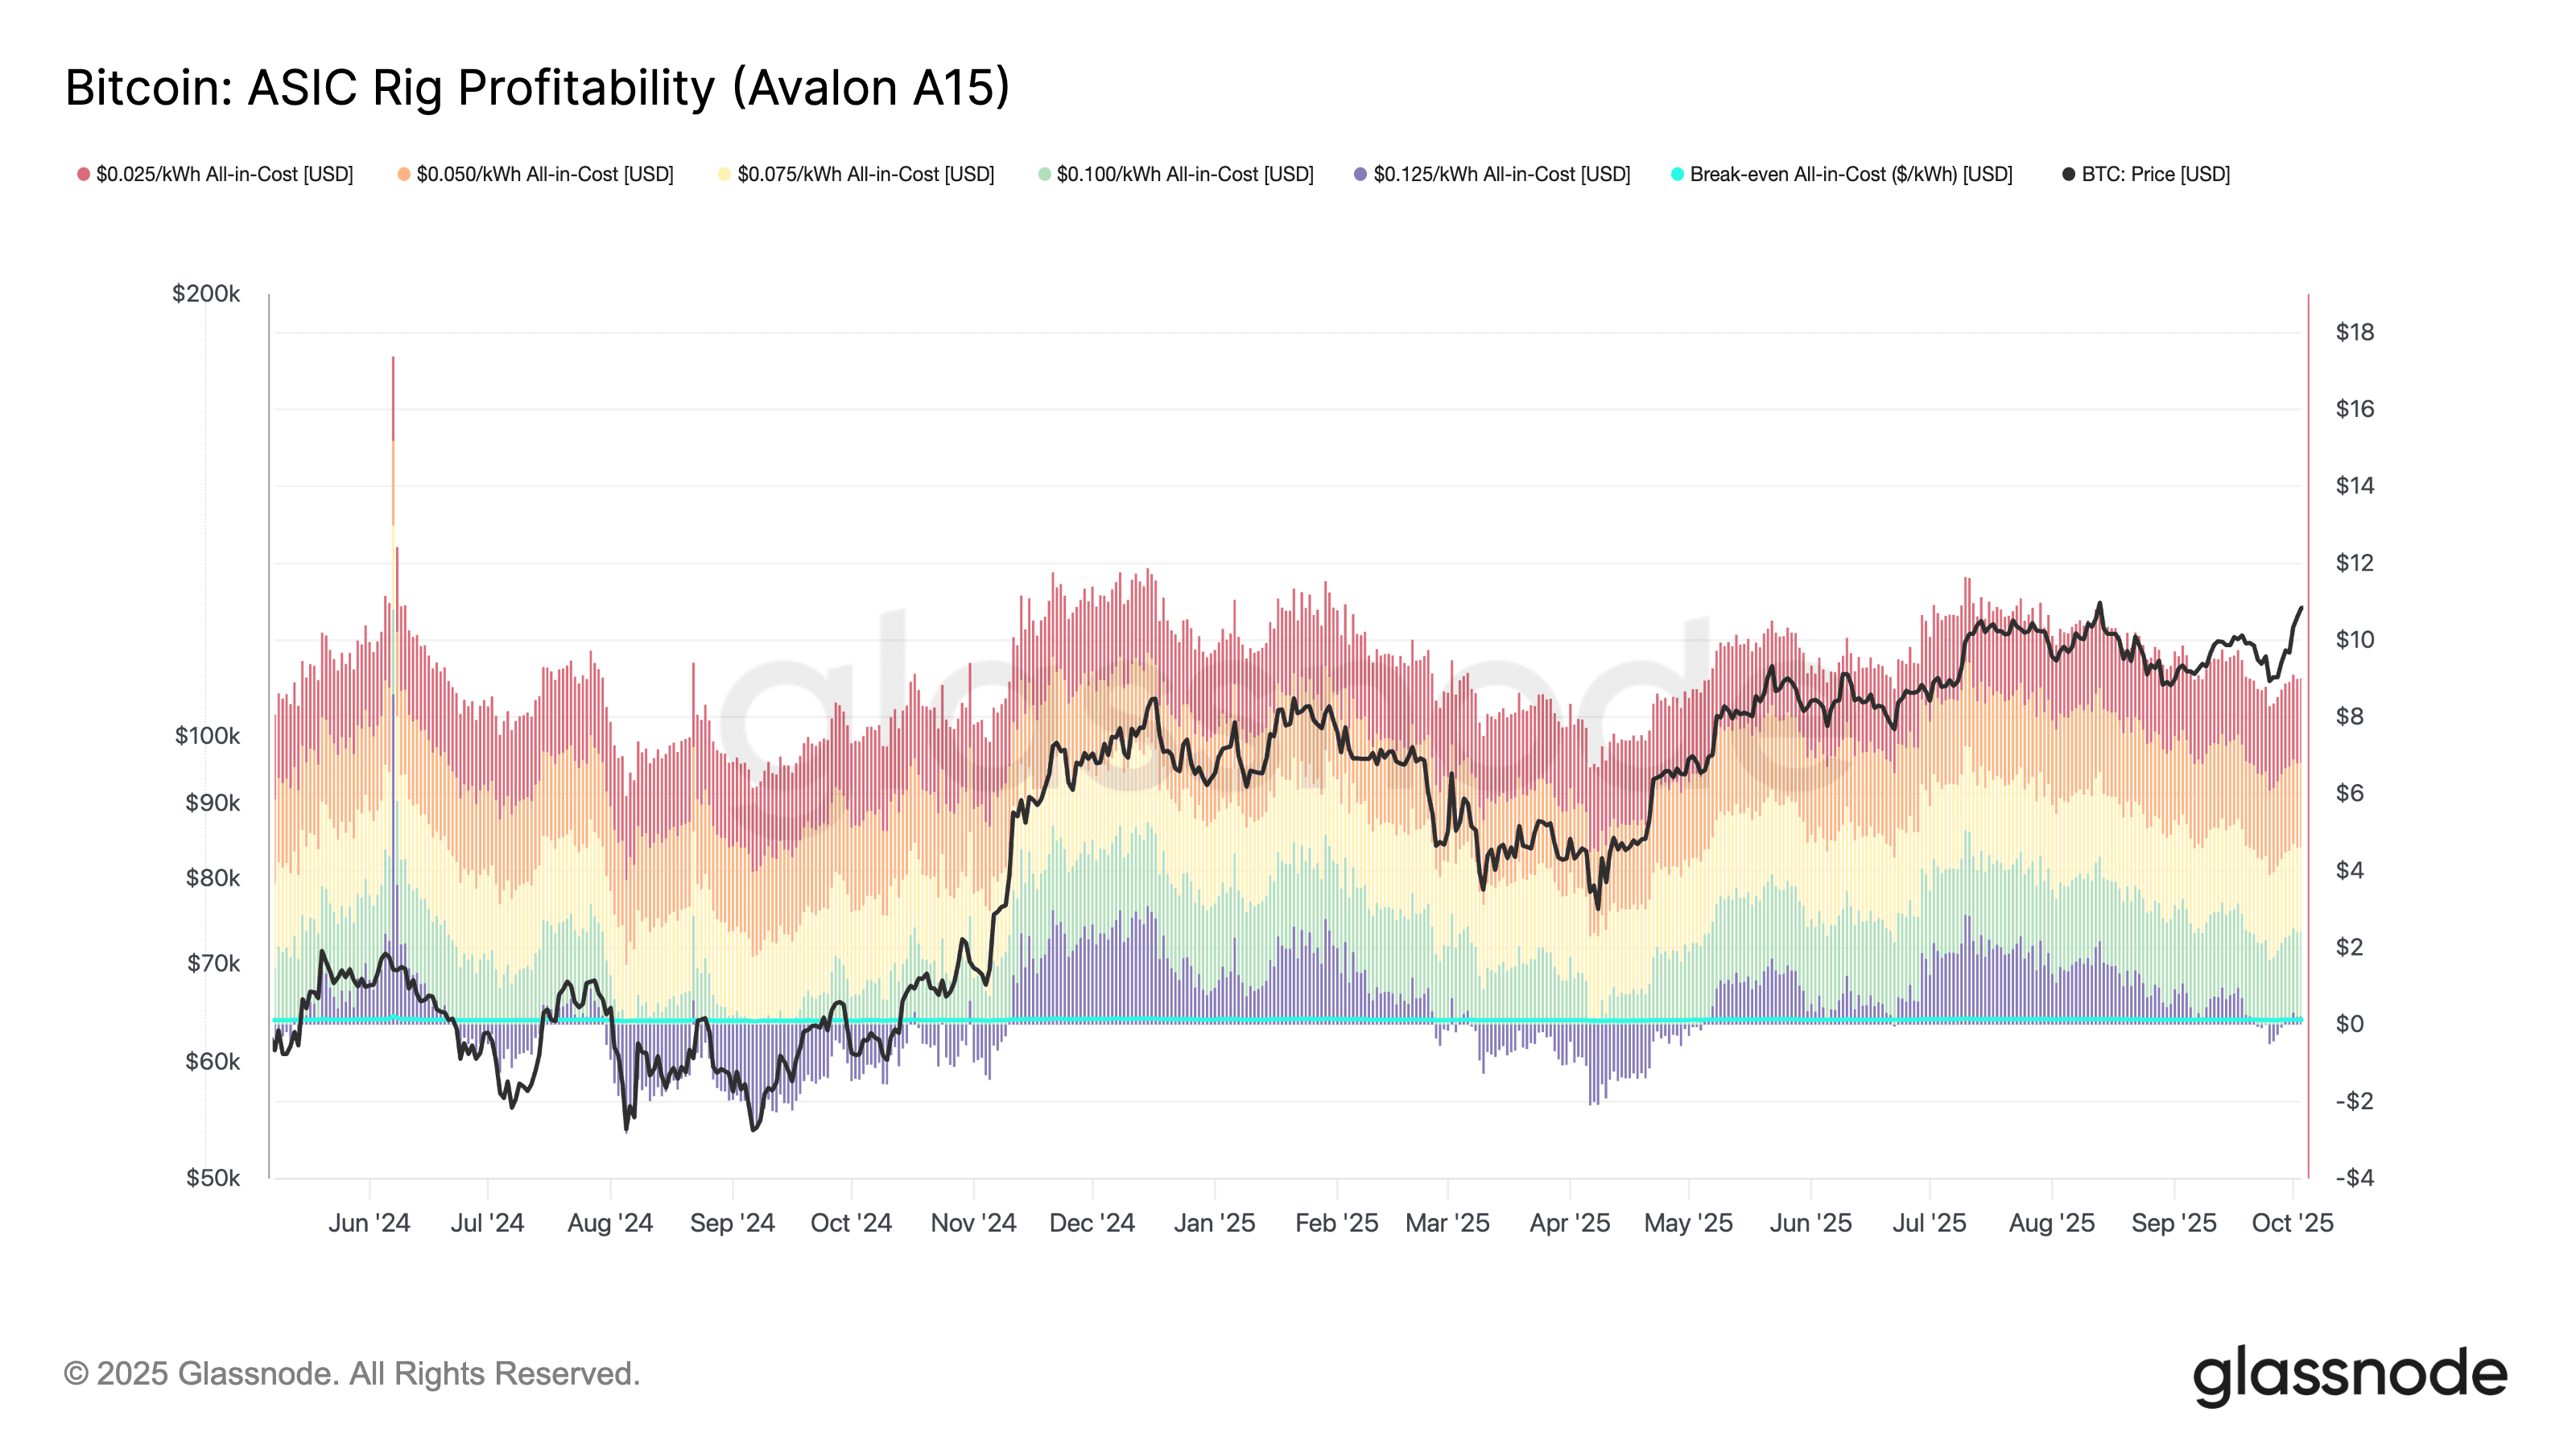
The ASIC Rig Profitability metric for the Avalon A15 tracks estimated daily profits under various all-in energy cost assumptions, ranging from $0.025 to $0.125 per kWh. It calculates profitability by subtracting the rig’s daily operating cost from its estimated block reward revenue based on a 218 TH/s hashrate and 3660W power consumption. Each band in the chart represents profitability at a different energy price point. This model is crucial for identifying breakeven thresholds and evaluating miner health under changing market conditions, especially across varying operational cost environments.
Profitability remained strong for miners operating below the $0.07 per kWh range, while higher-cost operators experienced tightening margins. At $0.05 per kWh, daily profits averaged about $9 to $10 per unit, declining to around $7 to $8 at $0.06 per kWh. Margins narrowed significantly among retail miners, defined here as those paying $0.075 to $0.10 per kWh, where daily earnings ranged between $3 and $5 per machine, with occasional dips near breakeven on weaker hashprice days. This gradient illustrates the widening divide between industrial-scale operations and smaller retail participants, where a five-cent increase in energy cost can cut profitability in half. The quarter’s data reinforces that efficient energy procurement remains the key determinant of long-term mining viability, with sub-$0.07 operators continuing to anchor profitability while retail miners face increasing pressure from higher difficulty and compressed margins.
Mining Dashboard Commentary
Most of the mining metrics this quarter reinforced the same structural trends that were already visible in Q2 rather than marking a major shift.
Difficulty continued to rise, but at a similar pace to the previous quarter, reflecting a steady inflow of new hashrate rather than a sudden surge. Hashprice compressed slightly further, but that was an incremental move rather than a significant change. The fee share of miner revenue remained low in both quarters, and while ASIC prices continued to drift down, the slope of that decline has moderated. Miner treasury behavior also stayed consistent: modest net distribution rather than aggressive selling or large-scale accumulation.
So in short, Q3 was a continuation of Q2’s story with tightening margins, rising difficulty, and stable network expansion. The main difference being that the landscape has settled into a more predictable equilibrium. The mining sector feels mature and competitive rather than volatile, where success depends less on market cycles and more on operational efficiency and energy pricing.
Conclusion
Bitcoin closed the third quarter positioned on solid structural footing. The alignment across investor behavior, cost basis models, and on chain profitability metrics shows a network operating in balance: optimistic yet rational, profitable yet not speculative. Institutional developments such as regulated stablecoin frameworks and the expansion of retirement plan access further integrated Bitcoin into the financial mainstream, while on-chain data reflected the confidence of both new and seasoned participants. Long-term holders continue to anchor supply, short-term traders provide healthy liquidity, and valuation metrics remain comfortably distant from overheated levels, all signs of a market consolidating strength rather than chasing momentum.
On the mining front, Q3 reinforced continuity rather than disruption. Difficulty rose modestly, fee revenue remained muted, and miner treasuries showed disciplined management. Profitability tightened but stayed positive for efficient operators, with sub seven cent power costs defining the new competitive baseline. The mining sector’s steady equilibrium and broader investor composure together underscore a maturing phase of the cycle, one where sustainability, efficiency, and capital discipline have replaced speculation as the driving forces of growth.